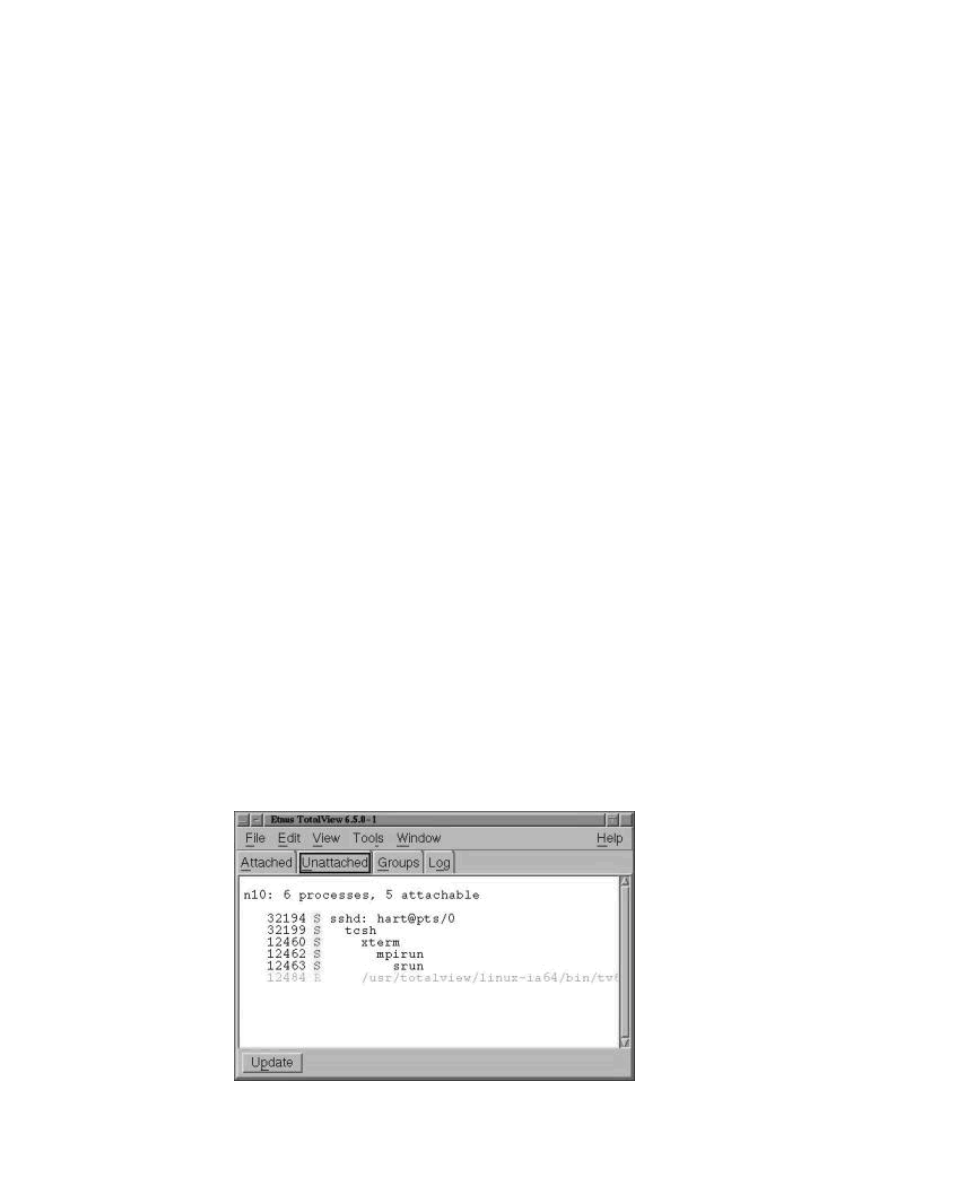
7 debugging running applications, Figure 4-4: unattached window – HP XC System 2.x Software User Manual
Page 66

7.
Click
Yes
in this pop-up window. The TotalView root window appears and displays
a line for each process being debugged.
If you are running Fortran code, another pop-up window may appear with the following
warning:
Sourcefile initfdte.f was not found, using assembler mode.
Click
OK
to close this pop-up window . You can safely ignore this warning.
8.
You can now set a breakpoint somewhere in your code. The method to do this may vary
slightly between versions of TotalView. For TotalView Version 6.0, the basic process
is as follows:
a.
Select
At Location
in the
Action Point
pull-down menu of the TotalView
process window.
b.
Enter the name of the location where you want to set a breakpoint.
c.
Click
OK
.
9.
Click the
Go
button to run the application and go to the breakpoint.
Continue debugging as you would on any system. If you are not familiar with TotalView, you
can click on
Help
in the right-hand corner of the process window for additional information.
4.2.1.7 Debugging Running Applications
As an alternative to the method described in Section 4.2.1.6, it is also possible to "attach" an
instance of TotalView to an application which is already running. The example presented here
assumes you have already completed the steps in Section 4.2.1.2 and Section 4.2.1.5.
1.
Compile a long-running application as in Section 4.2.1.6:
$ mpicc -g -o Psimple simple.c -lm
2.
Run the application:
$ mpirun -srun -n2 Psimple
3.
Start TotalView:
$ totalview
4.
In the TotalView Root Window, click
Unattached
to display a list of running processes
(Figure 4-4). Double-click on the
srun
process to attach to it.
Figure 4-4: Unattached Window
4-10
Debugging Applications
