Report selection, Standard report types – HP 3PAR System Reporter Software User Manual
Page 76
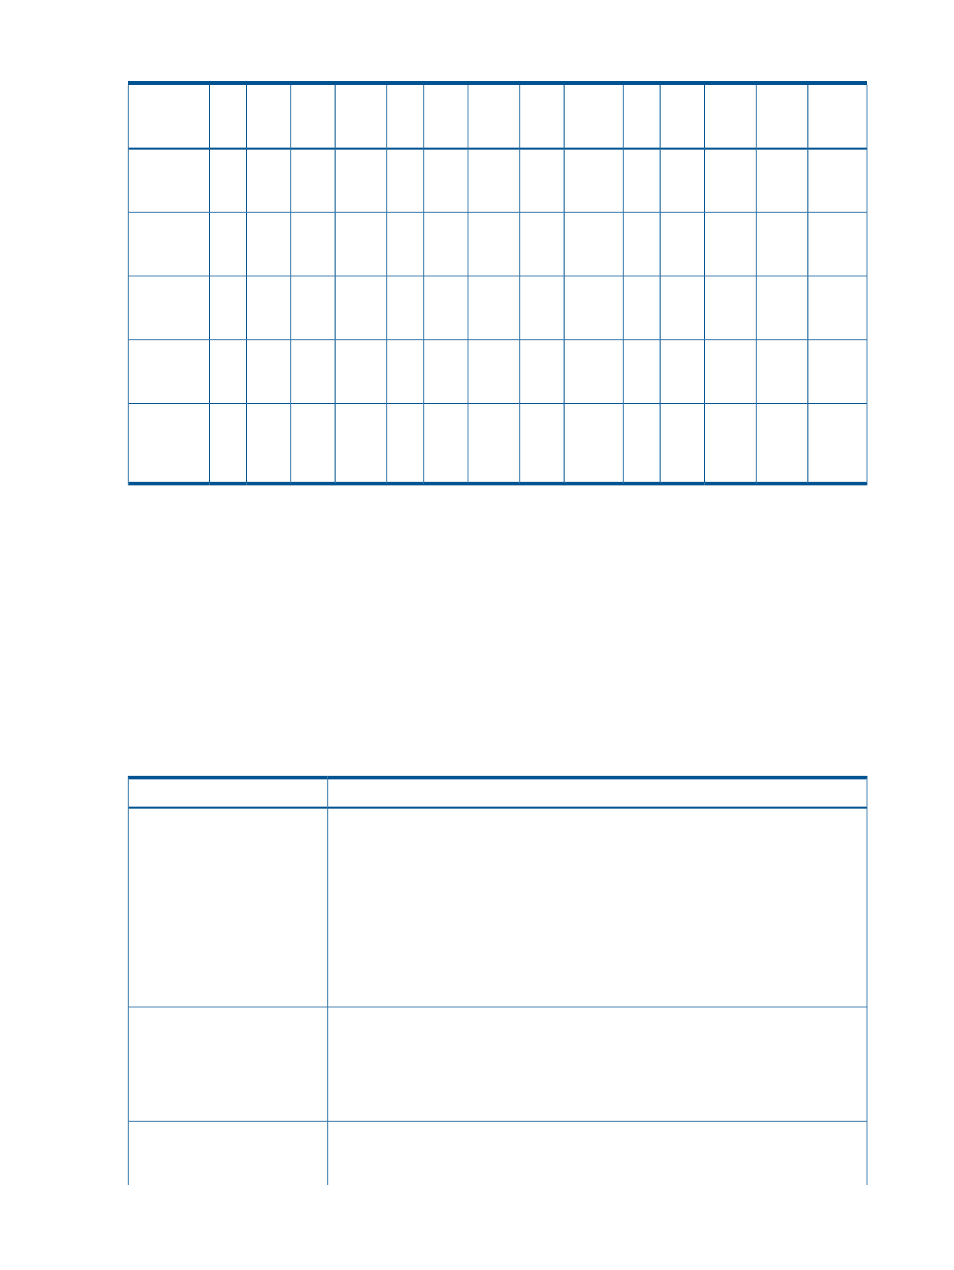
Table 10 Controls for Each Report (continued)
Adaptive
Optimization
Link
Perf
CPU
Perf
Node
Cache
Perf
VV
Cache
Perf
VLUN
Perf
LD
Perf
Port
Perf
PD
Perf
VV
Space
LD
Space
CPG
Space
PD
Space
Summary
Report:
Section and
Control
Y
Y
Y
Y
Y
Y
Y
Y
Y
Y
Y
Y
Y
T
T
T
T
T
T
T
T
T
T
T
T
Y
Y
Y
Y
Y
Y
Y
Y
Y
Y
Y
Y
Y
T
T
T
T
T
T
T
T
T
T
T
T
Y
Y
Y
Y
Detailed descriptions for each of the controls described in this table are provided in the following
sections.
Report Selection
For each report except for the Summary Report, you can use the Report Type pull-down list to
choose a report type. There are two selections of report types: standard report types and adaptive
optimization report types that only apply to the Adaptive Optimization feature that is available
through an optional license with System Reporter.
Standard Report Types
The following standard report types are available (
):
Table 11 Standard Report Types
Purpose
Report Type
Display metrics versus time. The beginning of the time range is specified by the Begin/At
Time control (see
) and the end of the time range is specified
by the End Time control (see
).
Versus Time
Unless the Compare control is available and set to something other than none, the
Versus Time report shows aggregate metrics for all the selected objects over a range
of time. See Figure 28 for an example.
If the Compare control (see section
) is set to a specific object,
then the Versus Time report plots the metrics separately for each of up to 16 of the
objects so that they can be compared. Figure 29 shows an example where the
performance of systems is being compared.
Display metrics at the time specified by the Begin/At Time control (see
). For this type of report, the Group By (see section
)
At Time
and Order By (see section
) controls are enabled and can be
used to compare different groupings of object type.
shows an example of an example with System and Host
selected in the Group By control and IOPs/s selected in the Order By control.
Display service time histogram versus time, with a separate data series for each service
time bucket between the Low Bucket (see
) and the High Bucket
(see
).
Histogram Versus Time
76
Accessing and Creating Reports