Vv tiers report – HP 3PAR System Reporter Software User Manual
Page 186
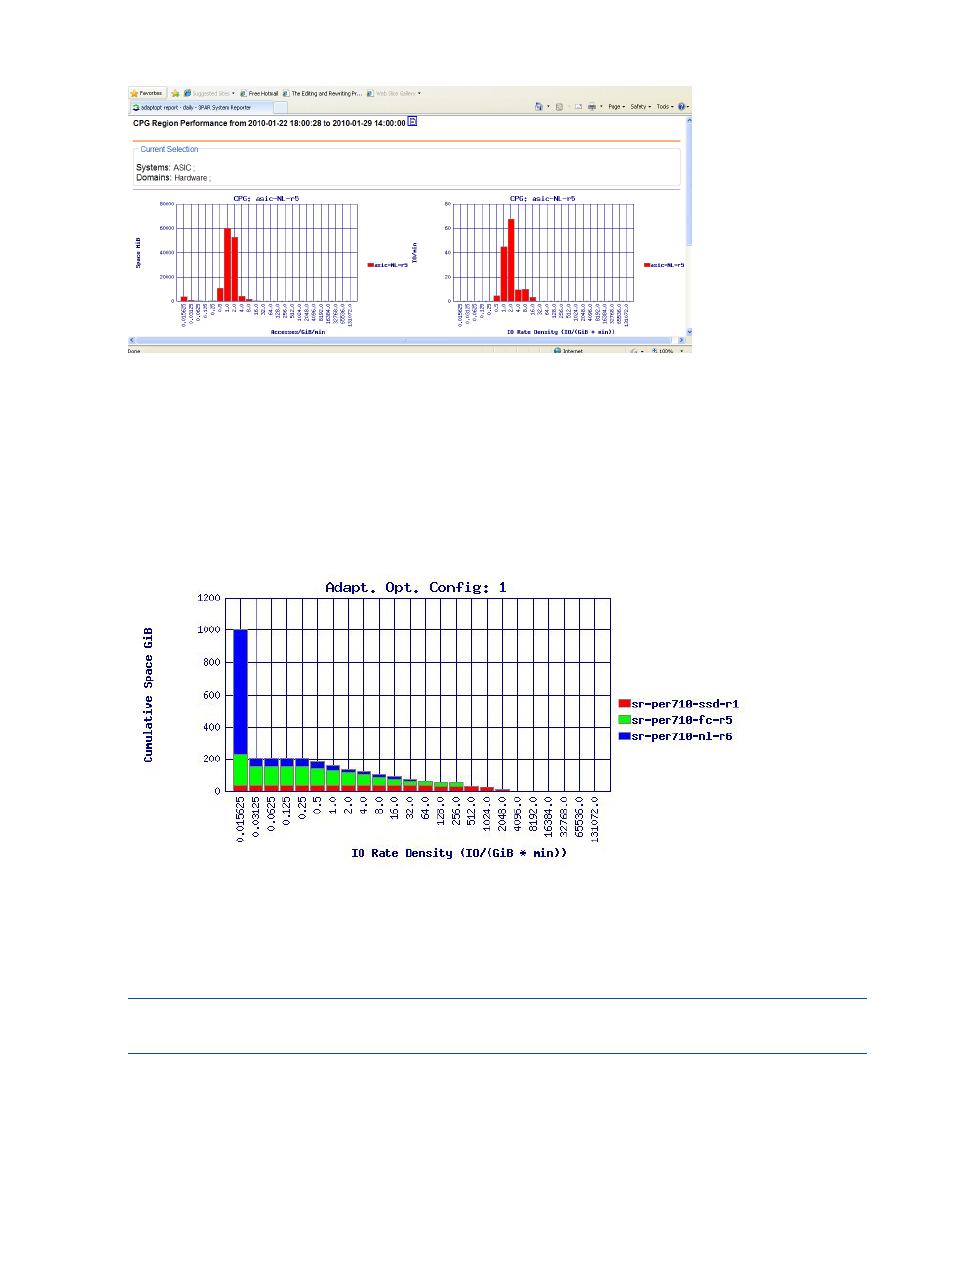
Figure 63 Region IO Density without Adaptive Optimization
You can see that much of the space is used for regions with very few IO accesses and most of the
IO accesses are handled by a very small number of regions. Adaptive Optimization would work
very well in this situation since the busiest regions would be moved to the fastest tier and the most
idle regions would be moved to the slowest tier.
A third report includes cumulative information that can assist in identifying ideal Adaptive
Optimization candidates, i.e., applications/profiles that stand to benefit based on the concentration
of I/O.
Figure 64 Region IO Density Showing Cumulative Space
The Cumulative Space chart is useful for the following purposes:
•
To determine the ideal candidates for Adaptive Optimization.
•
To identify what percent of capacity needs to remain or be removed from a high-performance
tier and what percent of IOPS are served for that particular Adaptive Optimization profile.
NOTE:
Some features provided by the cumulative reports are only implemented by the charts
provided through the Excel client due to limitations of the web based charting capabilities.
VV Tiers Report
The VV Tiers report shows the distribution of space in each VV among the tiers in an Adaptive
Optimization configuration, in absolute terms and also as a percentage (
).
186 Using Adaptive Optimization