Cpu performance metrics, Dkc performance metrics – HP XP Performance Advisor Software User Manual
Page 50
Description
Performance Metrics
Average Throughput
Throughput [KB/s]
Average I/O Response Time
IO response time [ms]
Back-end / Front-end I/O ratio
Back-end to Front-end IO ratio [%]
Back-end I/O
Cache lines staged/destaged [1/s]
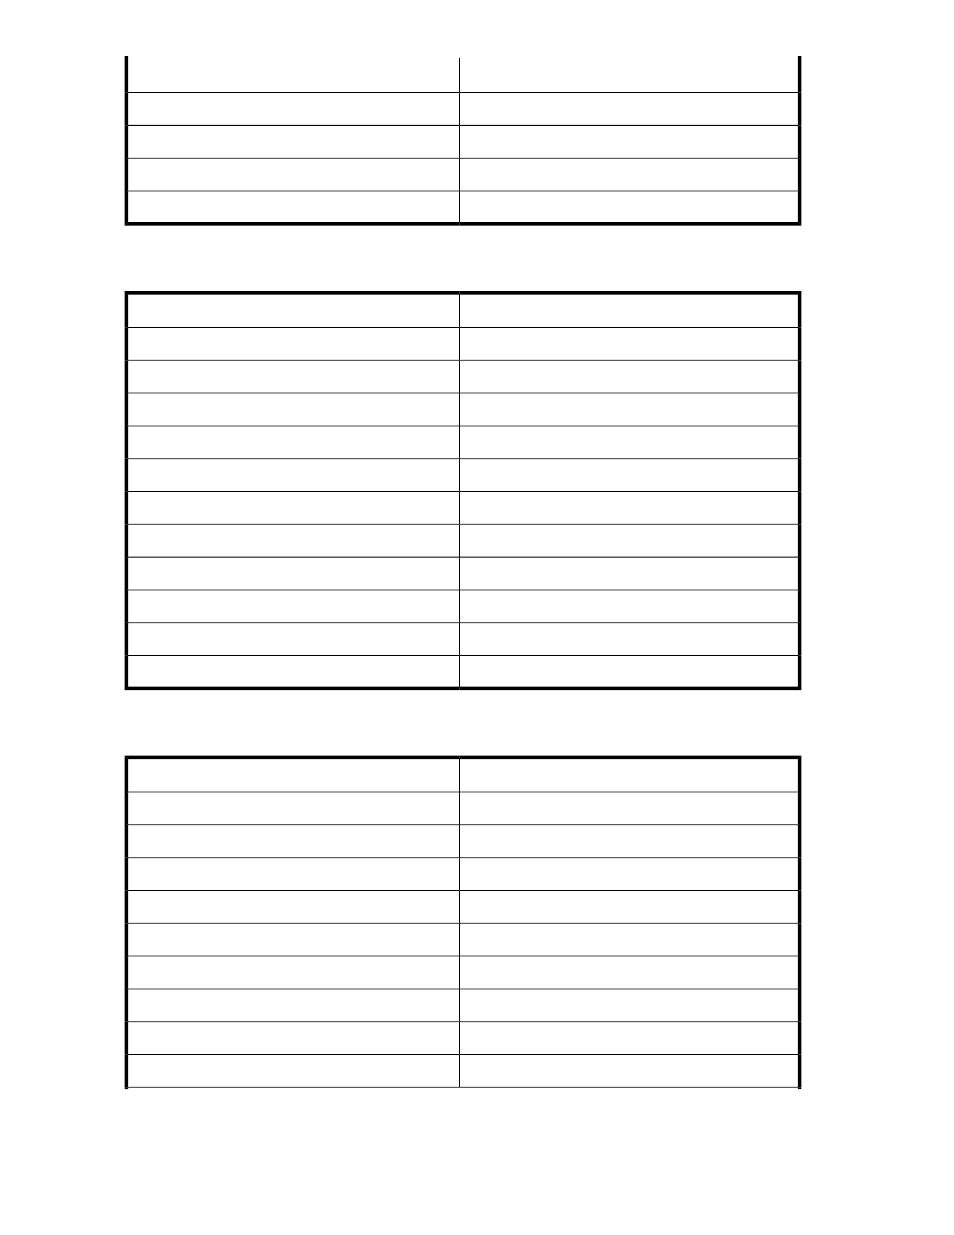
describes the CPU performance metrics.
Table 21 CPU performance metrics
Description
Performance Metrics
Minimum CPU utilization on PCB[%]
Minimum Utilization[%]
Maximum CPU utilization on PCB[%]
Maximum Utilization[%]
Average CPU utilization on PCB[%]
Average Utilization[%]
CHA PCB Busy Time for CPU 0(if installed)
Utilization for MP 0 0[1/s]
CHA PCB Busy Time for CPU 1(if installed)
Utilization for MP 1 0[1/s]
CHA PCB Busy Time for CPU 2(if installed)
Utilization for MP 2 0[1/s]
CHA PCB Busy Time for CPU 3(if installed)
Utilization for MP 3 0[1/s]
CHA PCB Busy Time for CPU 4(if installed)
Utilization for MP 4 0[1/s]
CHA PCB Busy Time for CPU 5(if installed)
Utilization for MP 5 0[1/s]
CHA PCB Busy Time for CPU 6(if installed)
Utilization for MP 6 0[1/s]
CHA PCB Busy Time for CPU 7(if installed)
Utilization for MP 7 0[1/s]
describes the DKC performance metrics.
Table 22 DKC performance metrics
Description
Performance Metrics
CHA to shared memory bus utilization [%]
CHA to shared memory utilization [%]
DKA to shared memory bus utilization [%]
DKA to shared memory utilization [%]
CHA to cache memory Xbar utilization [%]
CHA to cache memory utilization [%]
DKA to cache memory Xbar utilization [%]
DKA to cache memory utilization [%]
Cache usage for CLPR0 [MB]
Cache usage [MB]
Write cache usage for CLPR0 [MB]
Write cache usage [MB]
Side File usage for CLPR0 [MB]
Side File usage [MB]
Cache random read hits for CLPR0
Cache random read hits
Cache utilization for CLPR0
Cache utilization [%]
Viewing performance metrics in XPSketch
50