Reading values using cursors – Yokogawa PC-Based MX100 User Manual
Page 51
51
IM MX100-0E
Reading Values Using Cursors
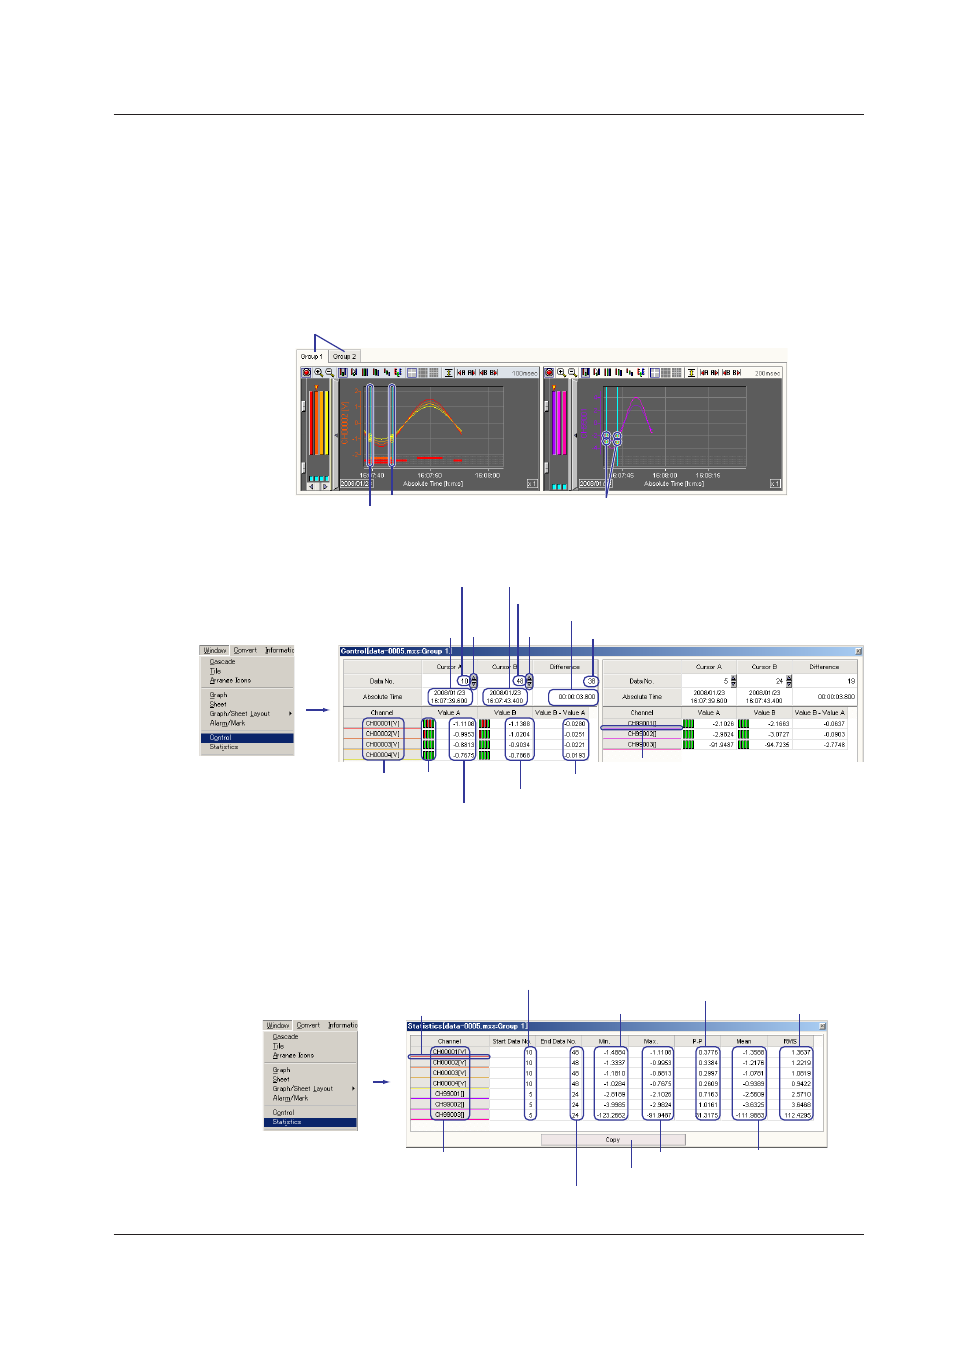
Click the tab of the group on which you wish to read values using cursors on the
waveform display window. Click the position where the measured (computed) data is
to be read in the waveform display area on the waveform display window. If you wish
to read another point simultaneously, drag the cursor. Cursor A appears at the position
where you first clicked; Cursor B appears at the position where you released the mouse
button. The measurement point is indicated by a yellow circle at the cross point of the
waveform and cursor. You can move the waveform that is displayed in the waveform
display area using the scroll buttons or scroll bar.
Cursor A
Cursor B
Measurement point
Group selection tab
You can show a window displaying the cursor measurement values (see the figure
below). From the
Window menu, choose Control.
Channel number and
measurement unit
Channel display color
Time between Cursors A and B
Time at Cursor B
Time at Cursor A
(value B) – (value A)
Value of Cursor B
Value of Cursor A
Alarm
indication
Data number at Cursor A
Move
Cursor A
Data number at Cursor B
Move
Cursor B
Difference in the data number between Cursors A and B
Statistical Computation over an Area of Measured Data
Show the cursors in the same fashion as when reading the values using cursors.
Cursor A is the start position of computation area; Cursor B is the end position of the
computation area.
From the
Window menu, choose Statistics to open the Statistics window shown in the
figure below.
Channel number and
measurement unit
Copy data to the clipboard
Channel display color
Data number at the start position of the
statistical computation over an area
Data number at the end position of the
statistical computation over an area
Minimum value
Maximum value
Maximum value – minimum value
Average value
RMS value
Operations of the MX100 Standard Software