2 chart panel, Figure 6-9: icmc – chart panel – IEI Integration AFL2-15A-H61 User Manual
Page 131
AFL2-15A-H61
Page 114
6.2.2 Chart Panel
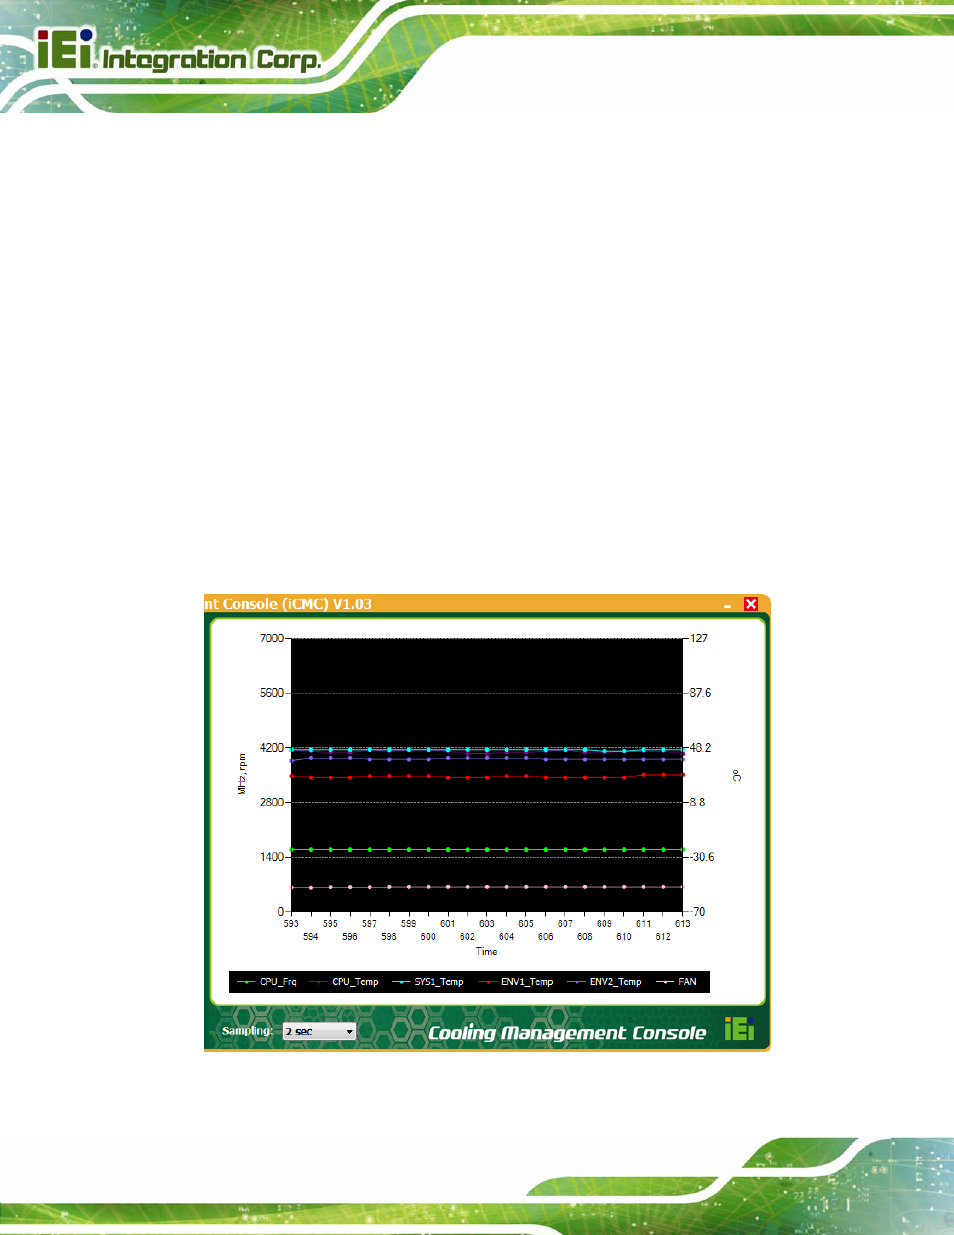
Figure 6-9 shows the chart panel interface. The line chart is used to visualize the system
data listed in the information panel. The following information is displayed in different color
lines:
Green: CPU frequency
Pink: CPU temperature
Blue: System temperature 1
Yellow: Environment temperature 1
Red: Environment temperature 2
Purple: Fan speed
The y-axis on the left represents the values for CPU frequency (MHz) and fan speed
(RPM) while the y-axis on the right represents the values for CPU, system and
environment temperatures.
Figure 6-9: iCMC – Chart Panel
See also other documents in the category IEI Integration Computers:
- UPC-V312-D525 v1.02 (176 pages)
- UPC-V312-D525 v1.10 (175 pages)
- UPC-12A_GM45 v1.00 (147 pages)
- UPC-12A_GM45 v2.00 (144 pages)
- UPC-12A_GM45 v2.10 (145 pages)
- UPC-V315-NM70 (148 pages)
- UPC-V315-Screw Driver (1 page)
- UPC-V315-QM77 (148 pages)
- S12ASR v1.12 (110 pages)
- S12ASR v3.00 (118 pages)
- PPC-5xxx-9455 v1.00 (198 pages)
- PPC-5xxx-9455 v1.10 (198 pages)
- PPC-WIDS-51xxA-G41 (152 pages)
- PPC-51xxA-H61 (193 pages)
- PPC-5152-D525 v1.02 (183 pages)
- PPC-5152-D525 v2.10 (185 pages)
- PPC-37xxA-N26 v1.00 (203 pages)
- PPC-37xxA-N26 v1.10 (200 pages)
- PPC-37xx-N270 v1.01 (165 pages)
- PPC-37xx-N270 v2.00 (155 pages)
- PPC-37xx-N270 v2.11 (155 pages)
- PPC-37xx-N270 v2.20 (162 pages)
- ACT-457A (67 pages)
- AFL-4 series-N270 v1.05 (165 pages)
- AFL-4 series-N270 v2.10 (166 pages)
- AFL-4 series-N270 v2.11 (168 pages)
- AFL-4 series-N270 v2.20 (168 pages)
- AFL-W19A_W19B_17D_W15A-GM45 v2.10 (138 pages)
- AFL-W19A_W19B_17D_W15A-GM45 v1.06 (138 pages)
- AFL-W19A_W19B_17D_W15A-GM45 v2.20 (151 pages)
- AFL-W15A_17D-GM45 v3.00 (148 pages)
- AFL-15i-HM55 v1.01 (139 pages)
- AFL-19i-HM55 v2.00 (140 pages)
- AFL-15i-HM55 v1.20 (143 pages)
- AFL-W19A_W19B_17D_W15A-N270 v1.06 (125 pages)
- AFL-W19A_W19B_17D_W15A-N270 v2.20 (124 pages)
- AFL-W19A_17D_W15A-N270 v3.00 (126 pages)
- AFL-15A_15AE-N270_UMN_v1.01.pdf (158 pages)
- AFL-15A-N270 v1.03 (159 pages)
- AFL-15A-N270 v2.10 (159 pages)
- AFL-15A-N270 v2.20 (158 pages)
- AFL-xxA-N26 (152 pages)
- AFL-xxA-N270-Series v1.03 (171 pages)
- AFL-xxA-N270-Series v2.00 (171 pages)
- AFL-xxA-N270-Series v2.11 (170 pages)