Digital phosphor oscilloscopes — dpo7000 series – Atec Tektronix-DPO7000 Series User Manual
Page 7
Digital Phosphor Oscilloscopes — DPO7000 Series
An integrated toolset for digital design and troubleshooting.
Interoperability with Logic Analyzers for Digital Design
and Debug
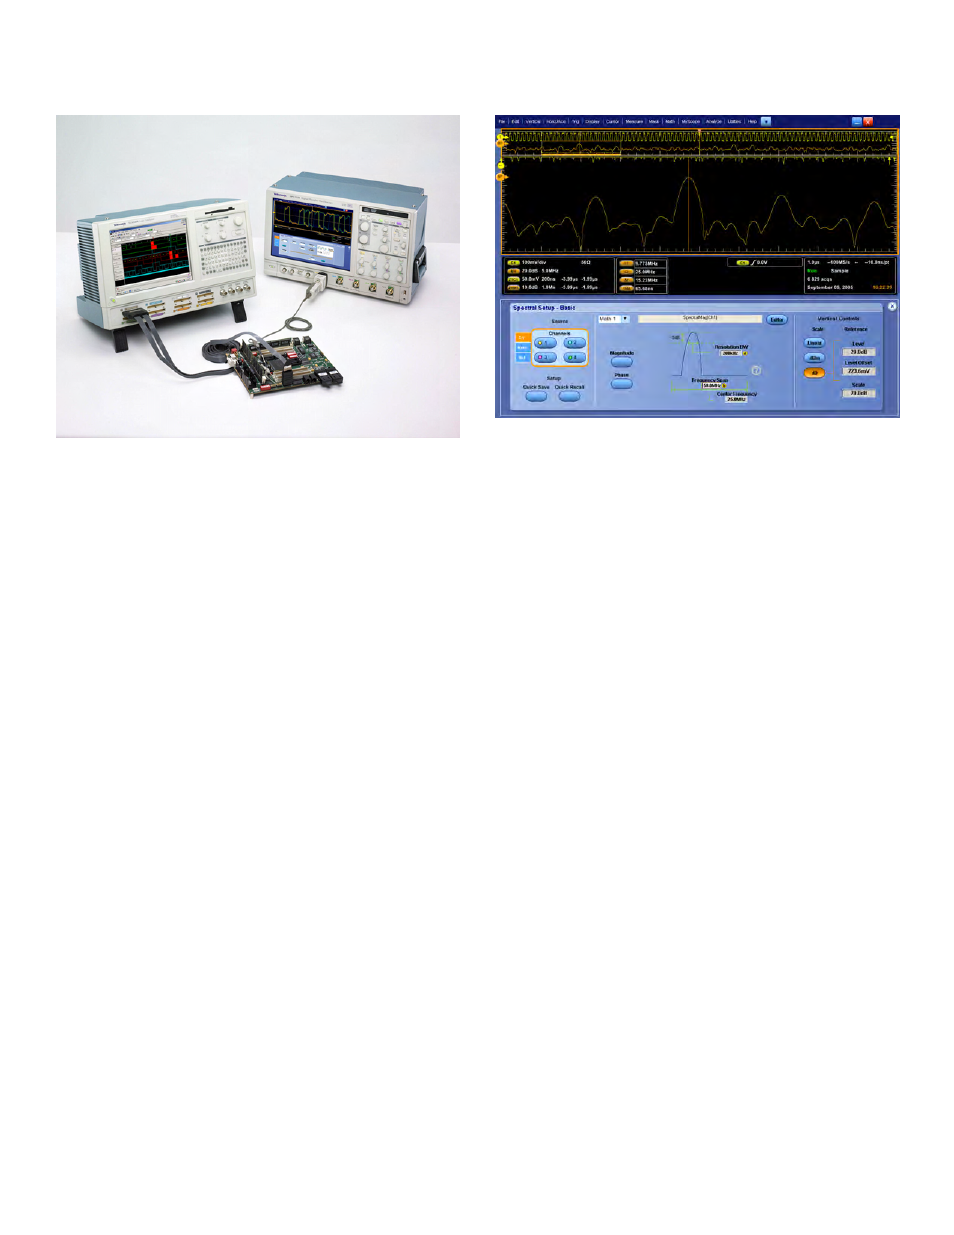
The Tektronix Integrated View (iView™) data display enables digital
designers to solve signal integrity challenges and effectively debug and
verify their systems more quickly and easily. This integration allows
designers to view time-correlated digital and analog data in the same
display window, and isolate the analog characteristics of the digital signals
that are causing systems failures. No user calibration is required. And, once
set up, the iView feature is completely automated.
More Insight into Your Complex Electrical
Design for Characterization and Compliance
Testing
The DPO7000 Series oscilloscopes offer the industry’s most comprehensive
set of analysis and compliance tools, such as a simple math expression,
waveform mask testing, a pass/fail compliance test, event searching, event
marking, or a custom application that you develop yourself.
Basic spectral UI control window.
A Wide Range of Built-in Advanced Waveform Analysis
Tools
Waveform cursors make it easy to measure trace-to-trace timing
characteristics, while cursors that link between YT and XY display modes
make it easy to investigate phase relationships and Safe Operating Area
violations. Select from 53 automatic measurements using a graphical
palette that logically organizes measurements into Amplitude, Time,
Combination, Histogram, and Communications categories. Gather further
insight into your measurement results with statistical data such as mean,
min, max, standard deviation, and population.
Define and apply math expressions to waveform data for on-screen results
in terms that you can use. Access common waveform math functions
with the touch of a button. Or, for advanced applications, create algebraic
expressions consisting of live waveforms, reference waveforms, math
functions, measurement values, scalars, and user-adjustable variables with
an easy-to-use calculator-style editor.
FFT –
To analyze your signal in the spectral domain, use the basic spectral
(provides you with the best parameter), or use advanced spectral with the
manual time base horizontal mode (to directly control the frequency span,
center frequency, and resolution bandwidth).
Filtering –
Enhance your ability to isolate or remove some important
component of your signal (noise or specific harmonics of the signal) by
creating your own filters, or using the filters provided as standard with the
instrument.
www.tektronix.com
7