Statistics at the touch of a button – Atec Fluke-OptiView User Manual
Page 3
3
Fluke Networks OptiView™ Integrated Network Analyzer
Statistics at the touch of a button
Selecting the statistics tab on the OptiView Analyzer provides you with
a wealth of information on utilization, protocols, top hosts and
conversations.
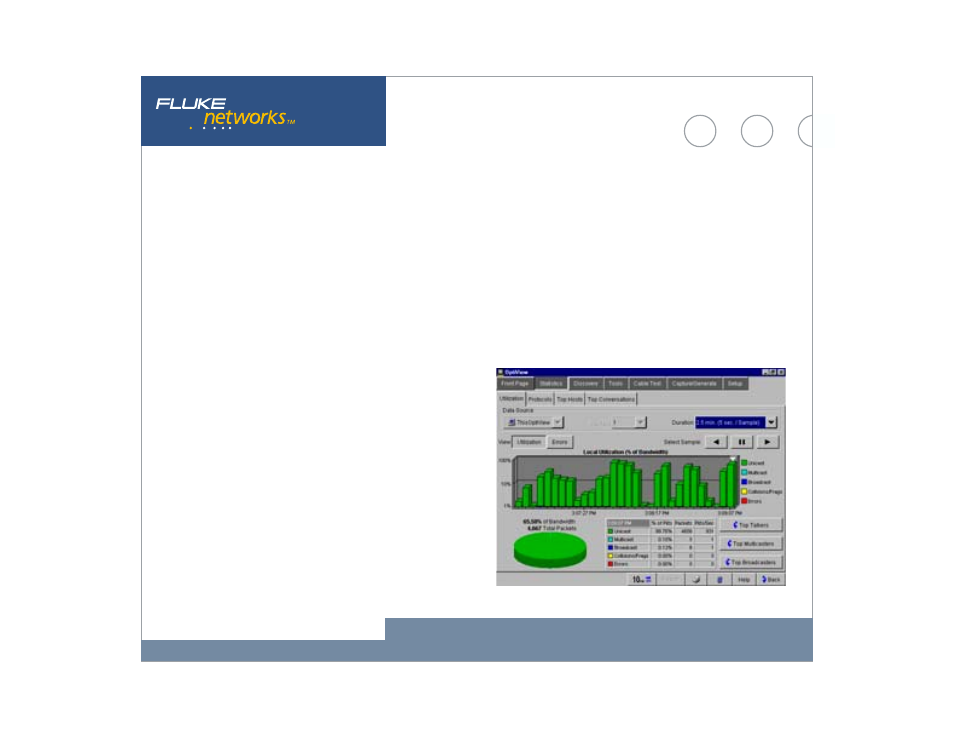
Utilization and Errors
This function provides an historical analysis on the performance and
health of the network segment to which the OptiView analyzer, is
attached. The default data source is the OptiView analyzer but the Data
Source drop down menu lists all RMON and RMON2 devices that have a
history study enabled. This function allows you to select a device
anywhere on your network and display the information gathered by
that device. Even multi-port devices can be interrogated on an
interface-by-interface basis. The utilization graph shows percentage
utilization over time. Based on the pre-configured RMON history studies
for the selected device, you can choose from any of the existing history
durations. The OptiView analyzer time interval is selectable from 2.5
minutes to 15 hours. Each sample is time stamped and the cursor may
be moved over any sample to provide additional information shown in
the table below the graph. The utilization screen also allows you to
display the Top Talkers, Top Multicasters and Top Broadcasters.
Switching the view from utilization to error mode displays a graph of
errors by CRC Alignment errors, oversize and undersize packets, fragments
and jabbers. A touch of the Top Error Sources button displays the names
and addresses of the stations responsible for generating the errors.