ETS-Lindgren HI-2200 RF Survey Meter User Manual
Page 32
32 |
Operation
G
RAPH
S
TYLE
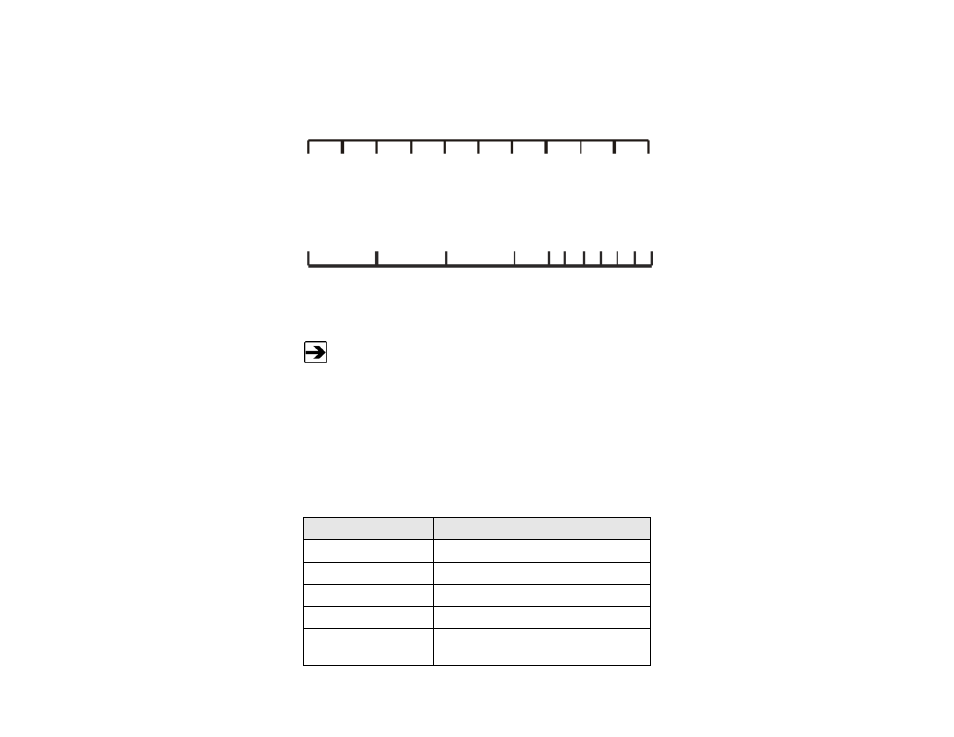
Graph Style enables the style of graph that will be displayed at the top of the
screen.
Linear Graph Scale
•
Linear produces a graph displayed that is directly proportional to the
measured field intensity. The display will indicate from 0% to 100% of
the full scale.
Log Graph Scale (flip)
•
Log produces a graph that is proportional to the log of the measured
field intensity from 10% to 100%.
When in spatial mode, SPATIAL AVG text replaces the graph.
A
VG
W
INDOW
Avg Window allows for the selection of the time interval used to calculate the
moving average. Moving average is an average of readings taken over a
selected period of time. Moving average readings assume that exposure has
been zero until the beginning of the averaging period. For example, to obtain a
true three minute moving average in an existing field, the meter must log data for
at least three minutes
Average Intervals
Description
3 MIN MOV
3 minute moving average
6 MIN MOV
6 minute moving average
12 MIN MOV
12 minute moving average
30 MIN MOV
30 minute moving average
RUNNING
A running average of all the data points
collected