Characteristic curves, Continued) – GE Industrial Solutions HW-HC004-005-006 Series User Manual
Page 14
Data Sheet
October 4, 2013
HW/HC004/005/006 Series DC-DC Power Module:
18-36Vdc & 36-75Vdc Input; 1.0V-5Vdc Output; 4A - 6A Output Current
LINEAGE
POWER
14
Characteristic Curves
(continued)
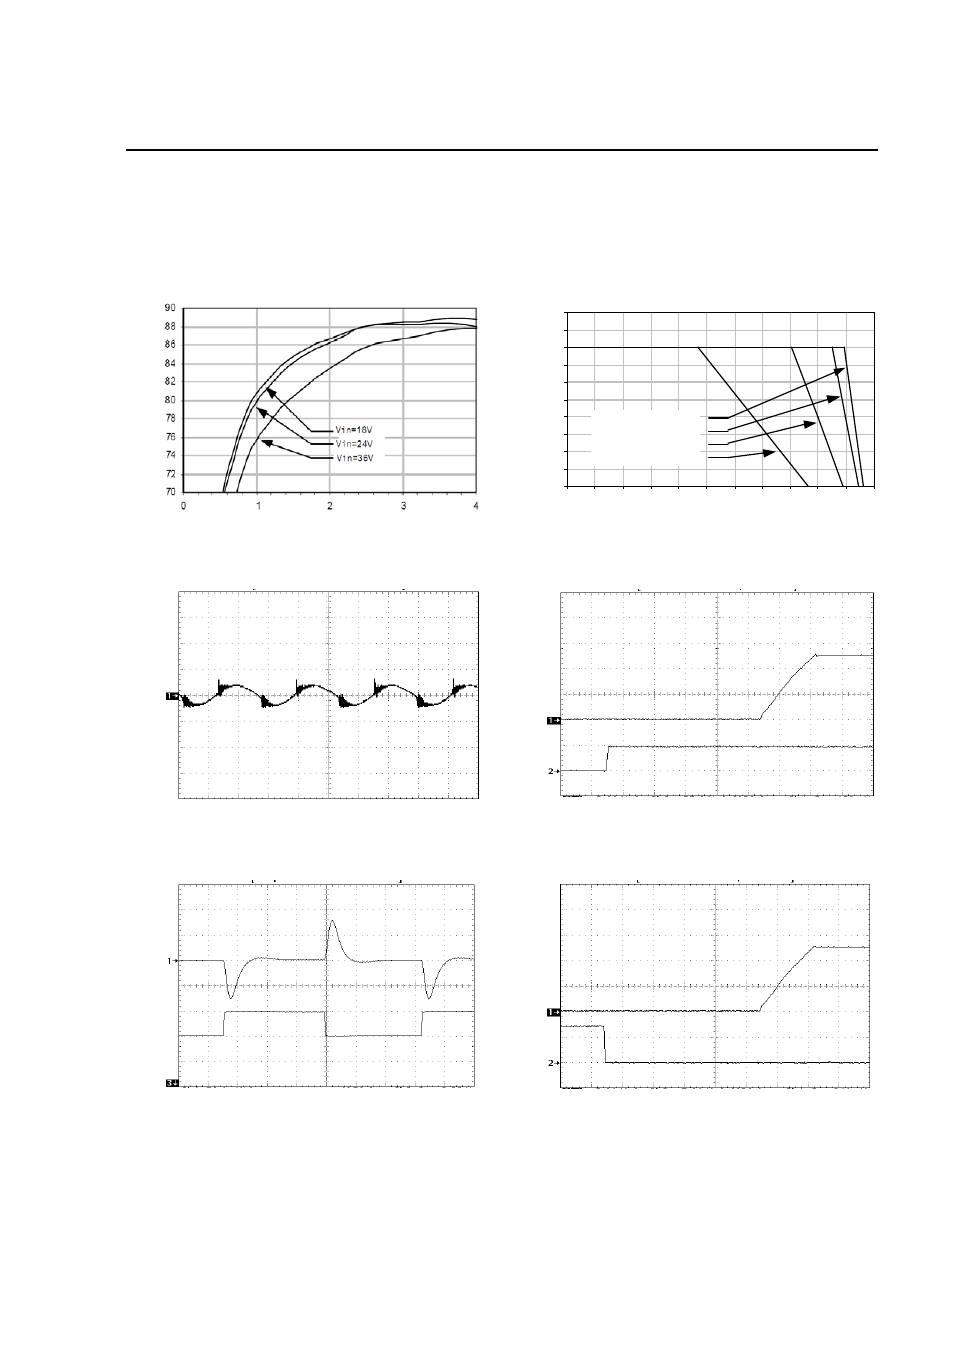
The following figures provide typical characteristics for the HC004A0A (5.0V, 4A) at 25ºC. The figures are identical for
either positive or negative Remote On/Off logic.
EF
F
IC
IEN
C
Y,
η
(%
)
O
UT
P
UT
CURRE
NT
, I
o
(A
)
0
1
2
3
4
5
0
10
20
30
40
50
60
70
80
90
100
110
3.0 m/s (600 ft./min.)
2.0 m/s (400 ft./min.)
1.0 m/s (200 ft./min.)
Natural Convection
OUTPUT CURRENT, I
O
(A)
AMBIENT TEMPERATURE, T
A
O
C
Figure 49. Converter Efficiency versus Output
Current.
Figure 52. Derating Output Current versus Local Ambient
Temperature and Airflow.
O
U
T
P
U
T
V
O
L
T
A
G
E
,
V
O
(V
) (2
0
m
V
/d
iv
)
IN
PU
T
VO
L
T
A
G
E,
O
U
T
PU
T
VO
L
T
A
G
E
V
IN
(V
)
(2
5
V
/d
iv
)
V
O
(V
) (
2
V
/d
iv
)
TIME, t (1
µs/div)
TIME, t (20ms/div)
Figure 50. Typical Output Ripple and Noise.
Figure 53. Typical Start-Up with application of Vin.
O
U
T
P
U
T
C
U
R
R
E
N
T
, O
U
T
P
U
T
V
O
L
T
A
G
E
I
O
(A
)
(1
A
/d
iv
)
V
O
(V
) (5
0
mV
/d
iv
)
On
/Off
V
OL
T
A
GE
, O
U
T
P
U
T
V
O
L
T
A
GE
V
O
N
/O
F
F
(V
) (
5
V
/d
iv
)
V
O
(V
) (
2
V
/d
iv
)
TIME, t (50
µs/div)
TIME, t (20ms/div)
Figure 51. Transient Response to Dynamic Load
Change from 50% to 75% to 50% of full load.
Figure 54. Typical Start-Up Using Remote On/Off,
negative logic version shown.