S 5—1, Characteristics curves, 8lineage power – GE Industrial Solutions LC-LW015-Series User Manual
Page 8: Continued), And t, 25 °c, 5 a at t, Figure 7. lx010aj typical cross regulation, v, Vs. i, With fixed i
8
Lineage Power
Data Sheet
March 27, 2008
18 Vdc to 36 Vdc or 36 Vdc to 75 Vdc Inputs, 10 W and 15 W
LC/LW010- and LC/LW015-Series Power Modules:
Characteristics Curves
(continued)
8-1787(C)
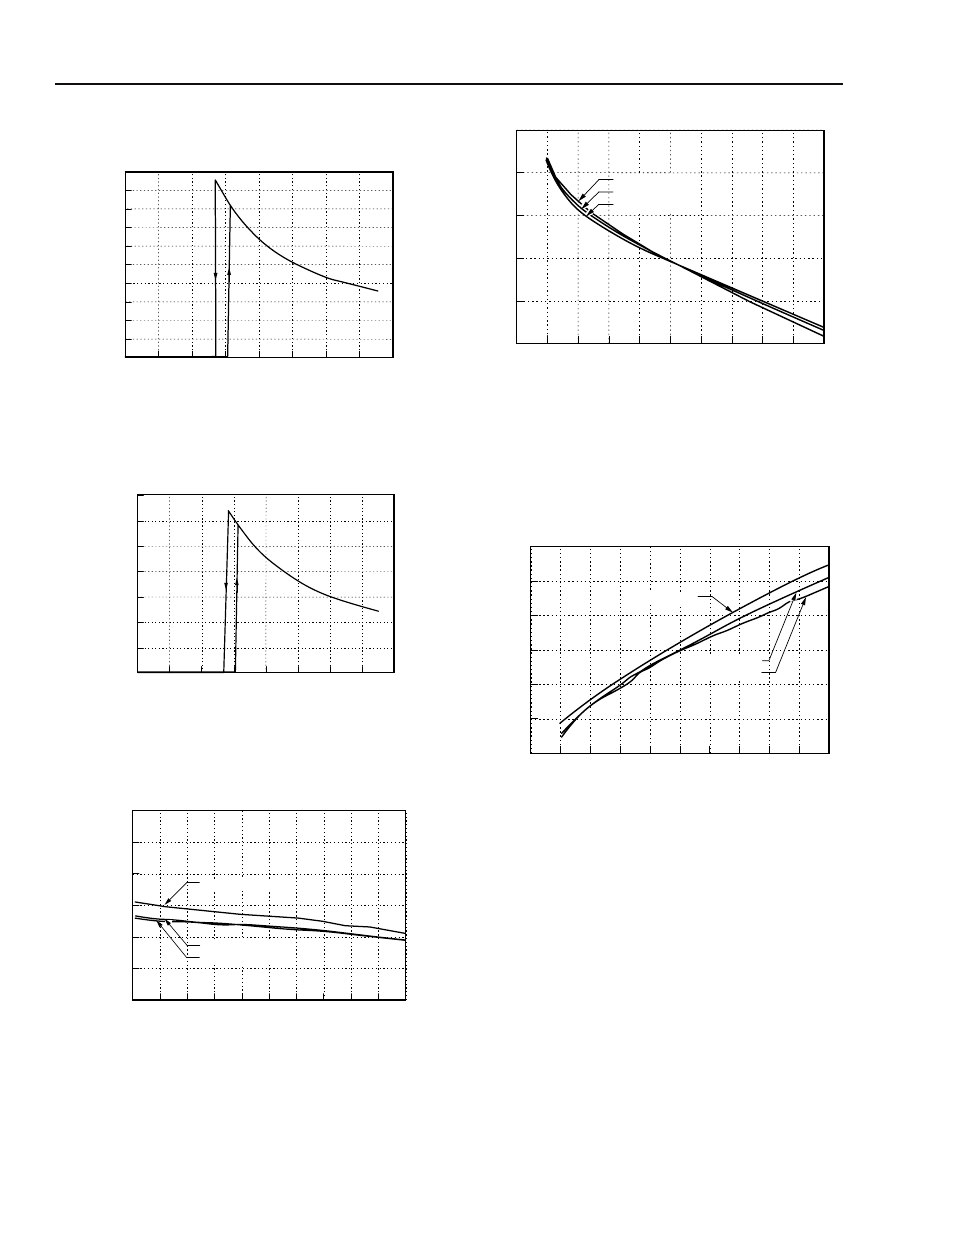
Figure 3. LW010 Input Current vs. Input Voltage at
I
O
= I
O
,
max
and T
C
= 25 °C
8-1788(C)
Figure 4. LW015 Input Current vs. Input Voltage at
I
O
= I
O
,
max
and T
C
= 25 °C
8-1789(C)
Figure 5. Lx010x/Lx015x Single-Output Load
Regulation, Normalized Output Voltage
vs. Normalized Output Current at
T
C
= 25 °C
8-1790(C)
Note: Output2 has characteristics similar to output1 when
I
O1
= 0.5 A and I
O2
varies.
Figure 6. Lx010AJ Typical Load Regulation of
Output1 with Fixed I
O2
= 0.5 A at
T
C
= 25 °C
8-1791(C)
Note: Output2 has characteristics similar to output1 when
I
O2
= 0.1 A and I
O1
varies.
Figure 7. Lx010AJ Typical Cross Regulation,
V
O1
vs. I
O2
with Fixed I
O1
= 0.1 A at
T
C
= 25 °C
10
20
30
50
40
60
0.00
0.30
INPUT VOLTAGE, V
I
(V)
0.20
0.15
0.25
70
0.40
80
0
0.35
0.10
0.05
0.45
0.50
INPUT CURRENT
,
I
I
(A)
0.2
0.0
0.4
0.6
0.7
0.1
0.3
0.5
10
20
30
70
40
80
0
60
50
INPUT VOLTAGE, V
I
(V)
INPUT CURRENT
,
I
I
(A)
0.1
0.2
0.6
0.7
0.8
0.9
0.997
1.002
NORMALIZED OUTPUT CURRENT (I
O
/I
O
,
max
)
1.000
0.999
1.001
1.0
0.0
1.003
0.998
0.4
0.5
0.3
V
I
= LOW LINE
V
I
= HIGH LINE
V
I
= NOM LINE
NORMALIZED OUTPUT
V
OL
T
A
GE
(V
O
/V
O
,
set
)
0.1
0.2
0.3
0.4
0.5
0.6
4.90
5.05
OUTPUT CURRENT 1, I
O1
(A)
5.00
5.10
1.0
0.0
4.95
0.7
5.15
0.8
0.9
V
I
= HIGH LINE
V
I
= LOW LINE
V
I
= NOM LINE
OUTPUT V
OL
T
A
GE
1,
V
O1
(V)
0.1
0.2
0.6
0.7
0.8
0.9
4.95
5.20
OUTPUT CURRENT 2, I
O2
(A)
5.10
5.05
5.15
1.0
0.0
5.25
5.00
0.4
0.5
0.3
V
I
= LOW LINE
V
I
= NOM LINE
V
I
= HIGH LINE
OUTPUT V
OL
T
A
GE
1,
V
O1
(V)