Module derating, Figure 61. experimental test setup, Layout considerations – GE Industrial Solutions LC-LW015-Series User Manual
Page 21: E 58): p, Thermal considerations, Lineage power 21, Continued), 25 °c
Lineage Power
21
Data Sheet
March 27, 2008
18 Vdc to 36 Vdc or 36 Vdc to 75 Vdc Inputs, 10 W and 15 W
LC/LW010- and LC/LW015-Series Power Modules:
Thermal Considerations
(continued)
8-1380(C)
Figure 58. LW010A, B, C Typical Power Dissipation
vs. Normalized Output Current at
T
C
= 25 °C
8-1816(C)
Figure 59. LW010F Typical Power Dissipation vs.
Output Current at T
C
= 25 °C
8-1817(C)
Figure 60. LW010AJ, BK, CL Typical Power
Dissipation vs. Normalized Output
Current at T
C
= 25 °C
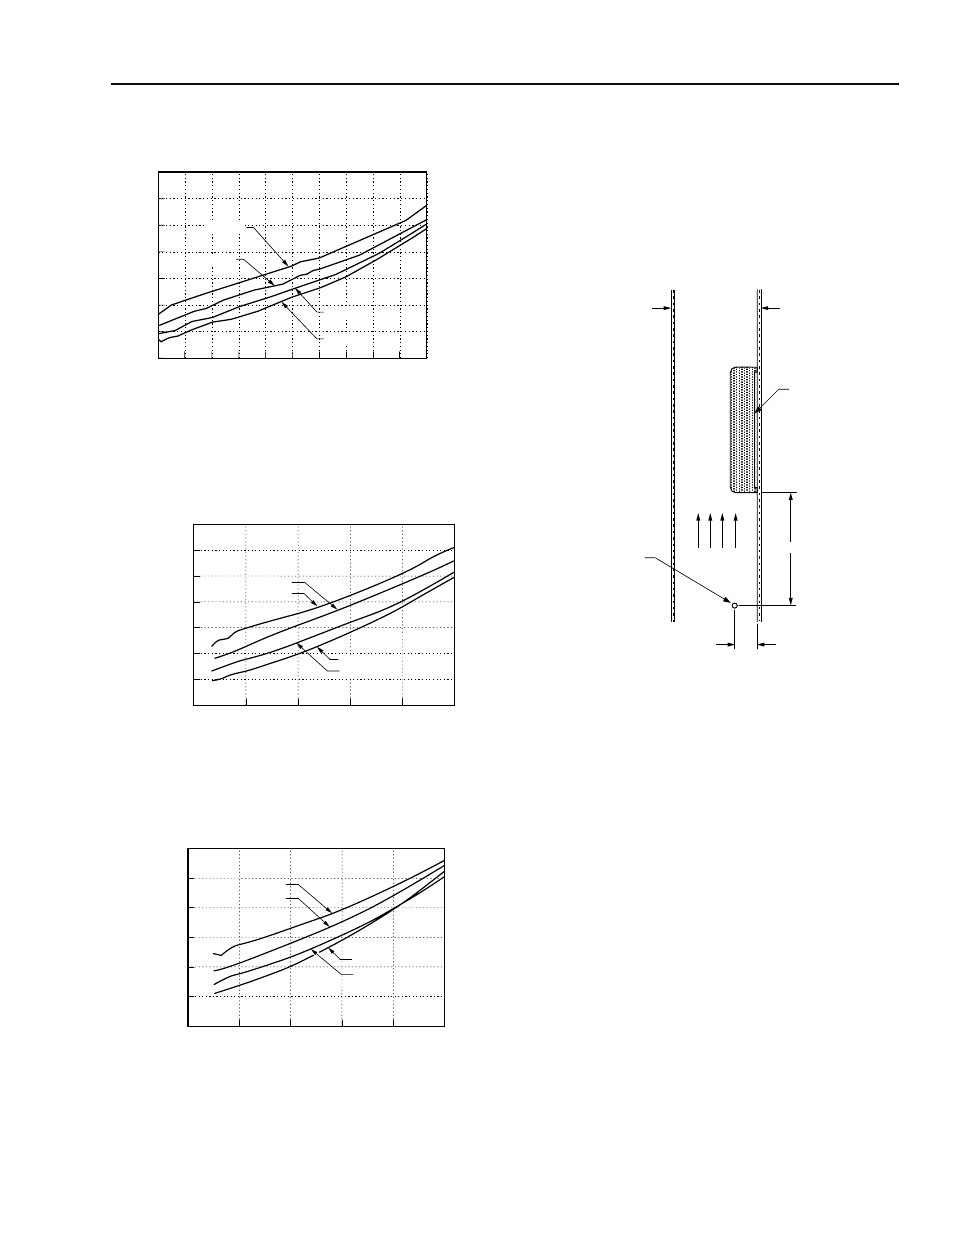
Module Derating
The derating curves in Figures 43 through 45 were
determined by measurements obtained in an experi-
mental apparatus shown in Figure 61. Note that the
module and the printed-wiring board (PWB) that it is
mounted on are both vertically oriented. The passage
has a rectangular cross section.
8-1126(C).d
Note: Dimensions are in millimeters and (inches).
Figure 61. Experimental Test Setup
Layout Considerations
Copper paths must not be routed beneath the power
module standoffs.
0.1
0.2
0.3
0.4
0.5
0.6
0.0
2.5
NORMALIZED OUTPUT CURRENT (I
O
/I
O
, max)
1.5
1.0
0.5
2.0
PO
WER DISSIP
A
TION,
P
D
(W)
V
I
= 75 V
3.5
0.7
0.8
0.9
1.0
0.0
V
I
= 48 V
V
I
= 36 V
3.0
V
I
= 60 V
1.0
0.0
2.0
3.0
3.5
0.5
1.5
2.5
0.5
1.0
1.5
2.0
2.5
0.0
OUTPUT CURRENT, I
O
(A)
V
I
= 36 V
V
I
= 48 V
PO
WER DISSIP
A
TION,
P
D
(W)
V
I
= 60 V
V
I
= 75 V
0.2
0.4
0.6
0.8
1.0
0.0
2.5
1.5
1.0
2.0
0.0
3.0
0.5
NORMALIZED OUTPUT CURRENT,
I
O1
= I
O2
[(I
O1
+ I
O2
)/(I
O1
,
max
+ I
O2
,
max
)]
V
I
= 36 V
V
I
= 48 V
V
I
= 60 V
PO
WER DISSIP
A
TION,
P
D
(W)
V
I
= 75 V
AIR VELOCITY
AND AMBIENT
TEMPERATURE
MEASURED
BELOW THE
MODULE
AIRFLOW
13 (0.5)
FACING PWB
MODULE
76 (3.0)
PWB