Characteristic curves (continued), Characteristic curves, Data sheet – GE Industrial Solutions Austin MicroLynx II 12V SIP User Manual
Page 7: Austin microlynx, Continued)
Data Sheet
January 18, 2010
Austin MicroLynx
II
TM
12V SIP Non-isolated Power Modules:
8.3 – 14Vdc input; 0.75Vdc to 5.5Vdc Output; 6A output current
Characteristic Curves
(continued)
The following figures provide typical characteristics for the MicroLynx
TM
II 12V SIP modules at 25ºC.
INPUT C
URREN
T
, I
IN
(A
)
0
0.5
1
1.5
2
2.5
3
3.5
4
4.5
7
8
9
10
11
12
13
14
Io = 6A
Io=3A
Io=0A
OU
TPU
T CU
RR
ENT,
OU
TPU
T
VOLT
AGE
I
O
(
A
) (
2A/d
iv)
V
O
(V)
(100mV
/div)
INPUT VOLTAGE, V
IN
(V)
TIME, t (5
μs/div)
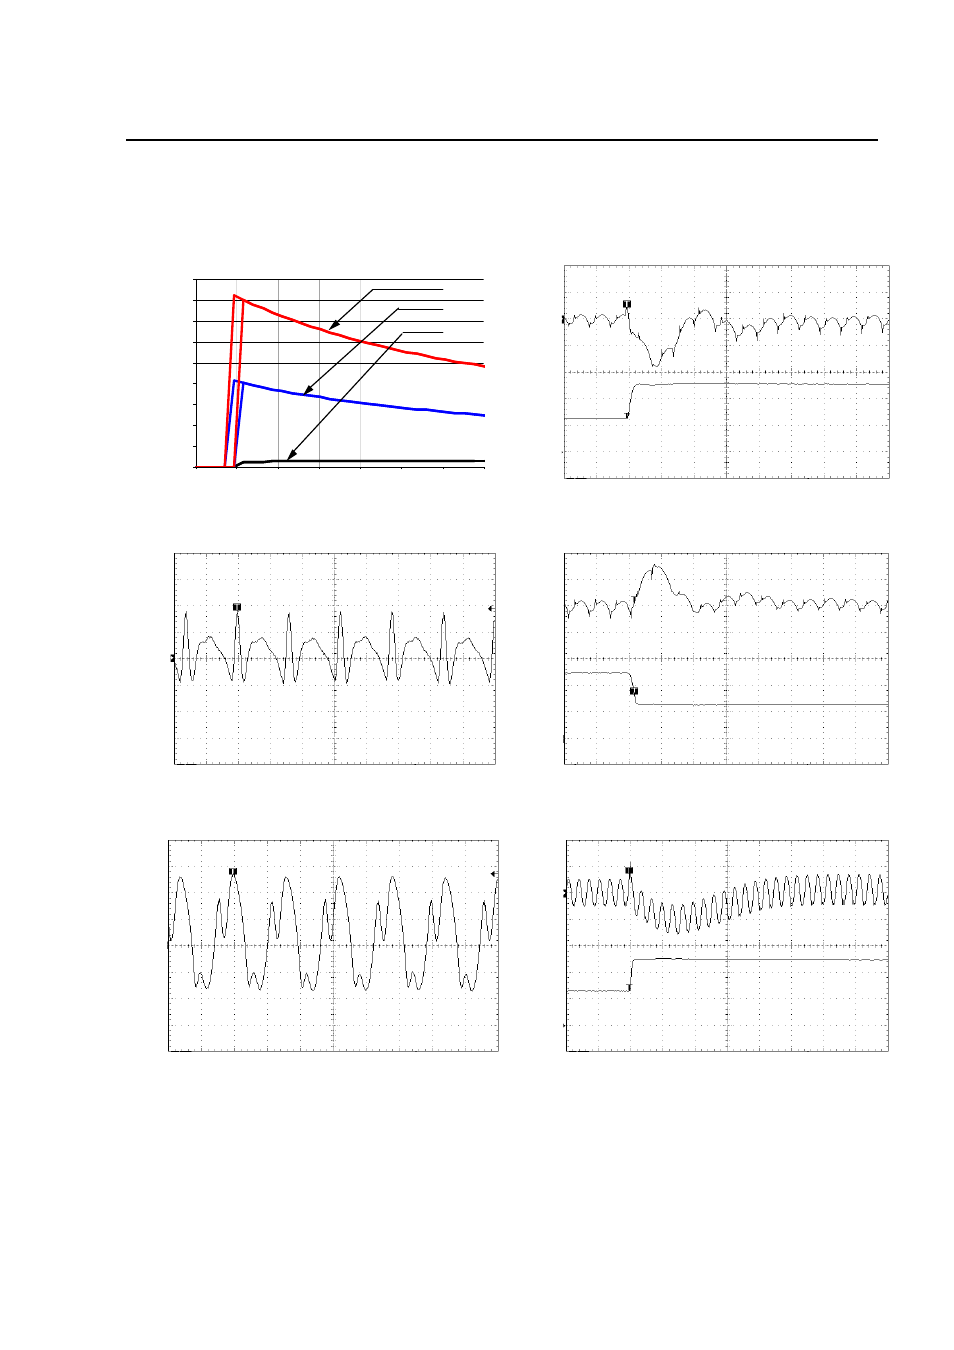
Figure 7. Input voltage vs. Input Current
(Vout = 5Vdc).
Figure 10. Transient Response to Dynamic Load
Change from 50% to 100% of full load (Vo = 3.3Vdc).
OUTP
UT VO
LTAG
E
V
O
(V
) (10mV
/di
v)
OU
TPU
T CU
RR
ENT,
OU
TPU
T
VOLT
AGE
I
O
(
A
) (
2A/d
iv)
V
O
(V)
(100mV
/div)
TIME, t (2
μs/div)
TIME, t (5
μs/div)
Figure 8. Typical Output Ripple and Noise
(Vin = 12V dc, Vo = 2.5 Vdc, Io=6A).
Figure 11. Transient Response to Dynamic Load
Change from 100% to 50% of full load (Vo = 3.3 Vdc).
OU
TPU
T
VOLTAGE
V
O
(V)
(
10mV/di
v)
OU
TPU
T CU
RR
ENT,
OU
TPU
T
VOLT
AGE
I
O
(
A
) (
2A/d
iv)
V
O
(V)
(100mV
/div)
TIME, t (2
μs/div)
TIME, t (10
μs/div)
Figure 9. Typical Output Ripple and Noise
(Vin = 12.0V dc, Vo = 3.3 Vdc, Io=6A).
Figure 12. Transient Response to Dynamic Load
Change from 50% to 100% of full load (Vo = 5.0 Vdc,
Cext = 2x150 μF Polymer Capacitors).
LINEAGE
POWER
7