Picotlynx, 3a: non-isolated dc-dc power modules, Data sheet – GE Industrial Solutions PicoTLynx 3A User Manual
Page 6: Characteristic curves
GE
Data Sheet
PicoTLynx
TM
3A: Non-Isolated DC-DC Power Modules
2.4Vdc –5.5Vdc input; 0.6Vdc to 3.63Vdc output; 3A Output Current
September 11, 2013
©2013 General Electric Company. All rights reserved.
Page 6
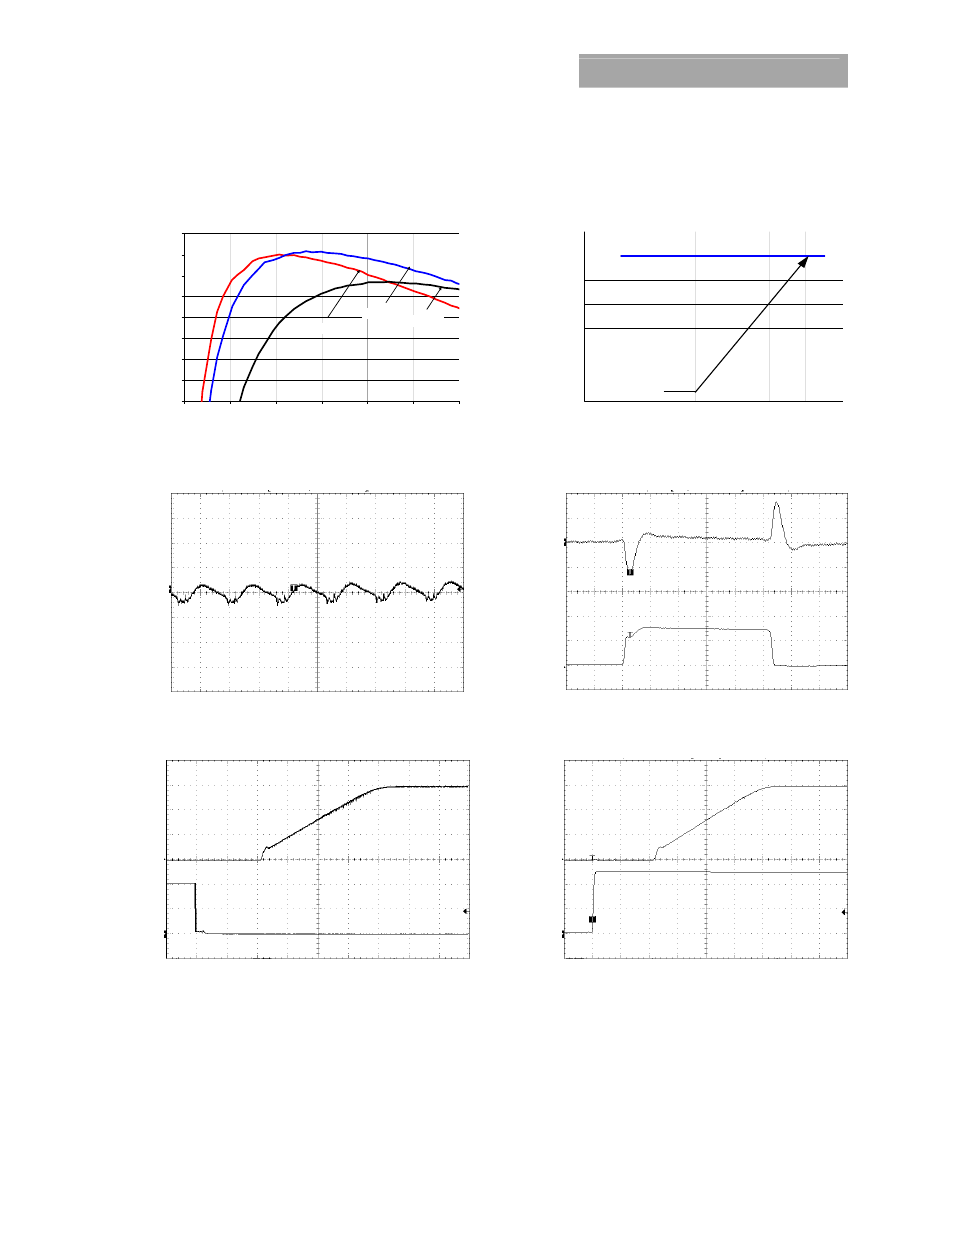
Characteristic Curves
The following figures provide typical characteristics for the Pico TLynx
TM
3A modules at 0.6Vo and at 25
o
C.
EFFICIE
N
C
Y,
η
(%
)
70
72
74
76
78
80
82
84
86
0
0.5
1
1.5
2
2.5
3
Vin=5.5V
Vin=2.4V
Vin=3.3V
OUTPUT CUR
REN
T, Io
(A)
0
0.5
1
1.5
2
2.5
3
3.5
20
30
40
50
60
70
80
90
0 LFM
OUTPUT CURRENT, I
O
(A)
AMBIENT TEMPERATURE, T
A
O
C
Figure 1. Converter Efficiency versus Output Current.
Figure 2. Derating Output Current versus Ambient
Temperature and Airflow.
OUT
PU
T V
O
LT
AGE
V
O
(V
) (2
0m
V/
di
v)
OU
TP
U
T C
U
RR
EN
T,
OU
TP
U
T V
O
LT
AG
E
I
O
(A
) (
1A
div
)
V
O
(V) (100
mV/di
v)
TIME, t (1
μs/div)
TIME, t (20
μs /div)
Figure 3. Typical output ripple and noise (V
IN
= 5V, I
o
= I
o,max
).
Figure 4. Transient Response to Dynamic Load Change
from 0% to 50% to 0% with V
IN
=5V.
O
N
/O
FF VO
LT
AG
E
O
U
TPU
T V
O
LT
AG
E
V
ON
/O
FF
(V
) (
2V
/di
v)
V
O
(V) (200
mV/di
v)
I
N
PU
T VO
LT
AG
E
O
U
TPU
T V
O
LT
AG
E
V
IN
(V
) (
2V
/di
v)
V
O
(V
) (2
00
m
V/
di
v)
TIME, t (1ms/div)
TIME, t (1ms/div)
Figure 5. Typical Start-up Using On/Off Voltage (I
o
= I
o,max
).
Figure 6. Typical Start-up Using Input Voltage (V
IN
= 5V, I
o
= I
o,max
).