Characteristic curves – GE Industrial Solutions EVW020A0S6R0 Series (Eighth-Brick) User Manual
Page 5
Data Sheet
March 3, 2011
EVW020A0S6R0 Series Eighth-Brick Power Modules
36–75Vdc Input; 6.0Vdc Output; 20A Output Current
LINEAGE
POWER
5
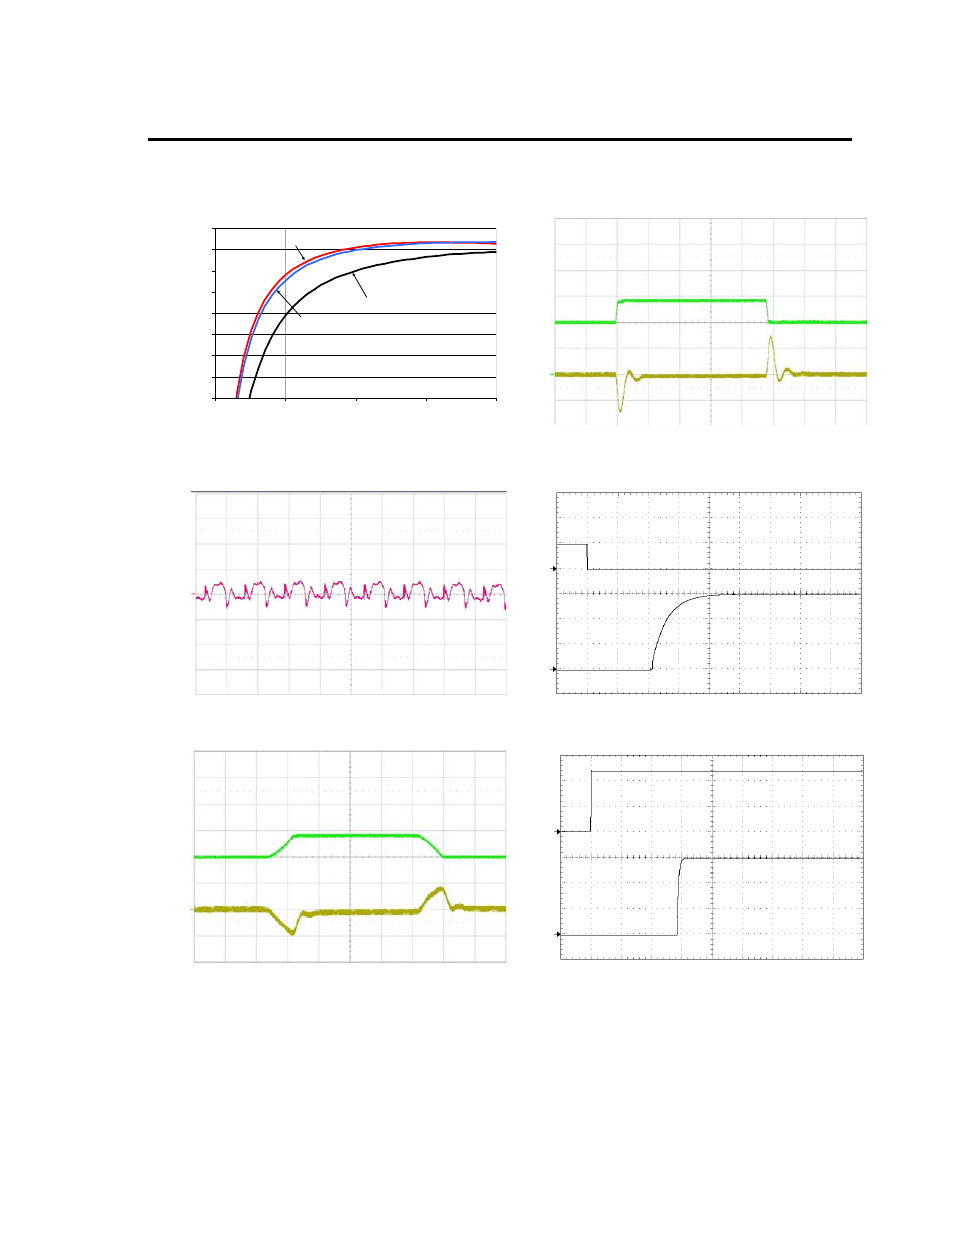
Characteristic Curves
The following figures provide typical characteristics for the EVW020A0S6R0 (6.0V
dc
, 20A) at 25
o
C. The figures are identical for
either positive or negative remote On/Off logic.
E
F
FICI
E
N
CY,
(%)
70
73
76
79
82
85
88
91
94
0
5
10
15
20
Vin = 36V
Vin = 48V
Vin = 75V
OU
T
P
U
T
VO
LTA
G
E
OU
TP
U
T
CURR
E
N
T
V
O
(V
) (
1
00
mV
/d
iv
)
I
O
(
A
)
(5
A
V
/d
iv
)
OUTPUT CURRENT, I
O
(A)
TIME, t (100µs/div)
Figure 1. Converter Efficiency versus Output Current.
Figure 4. Transient Response to 1.0A/µS Dynamic
Load Change from 50% to 75% to 50% of full load.
O
U
TP
U
T
VOLTAGE
V
O
(V
) (2
0m
V
/d
iv)
O
U
T
P
UT
V
O
LT
A
G
E
O
n/Of
f VO
LT
AG
E
V
O
(
V
)
(2
V/
di
v)
V
O
n/O
ff
(V
)
(5
V
/div
)
TIME, t (2
s/div)
TIME, t (5ms/div)
Figure 2. Typical output ripple and noise (V
IN
= V
IN,NOM
,
I
O
= I
O,max
).
Figure 5. Typical Start-up Using Remote On/Off,
negative logic version shown (V
IN
= V
IN,NOM
, I
O
= I
O,max
).
O
U
T
P
UT
VO
LT
A
G
E
O
U
T
P
UT
C
U
RRE
NT
V
O
(V
) (1
00
m
V
/d
iv
)
I
O
(
A
)
(5AV/
di
v)
O
U
T
P
UT
V
O
LT
A
G
E
I
N
P
U
T
V
O
LT
A
G
E
V
O
(V
) (2
V/
di
v)
V
IN
(V
)
(20V
/d
iv
)
TIME, t (100µs/div)
TIME, t (50ms/div)
Figure 3. Transient Response to 0.1A/µS
Dynamic
Load Change from 50% to 75% to 50% of full load.
Figure 6. Typical Start-up Using Input Voltage (V
IN
=
V
IN,NOM
, I
O
= I
O,max
).