Characteristic curves – GE Industrial Solutions EQW012-020-023-025 Series User Manual
Page 6
Data Sheet
October 5, 2013
EQW012/020/023/025 Series, Eighth-Brick Power Modules:
36 - 75Vdc Input; 1.2Vdc to 5Vdc Output; 12A to 25A Output
LINEAGE
POWER
6
Characteristic Curves
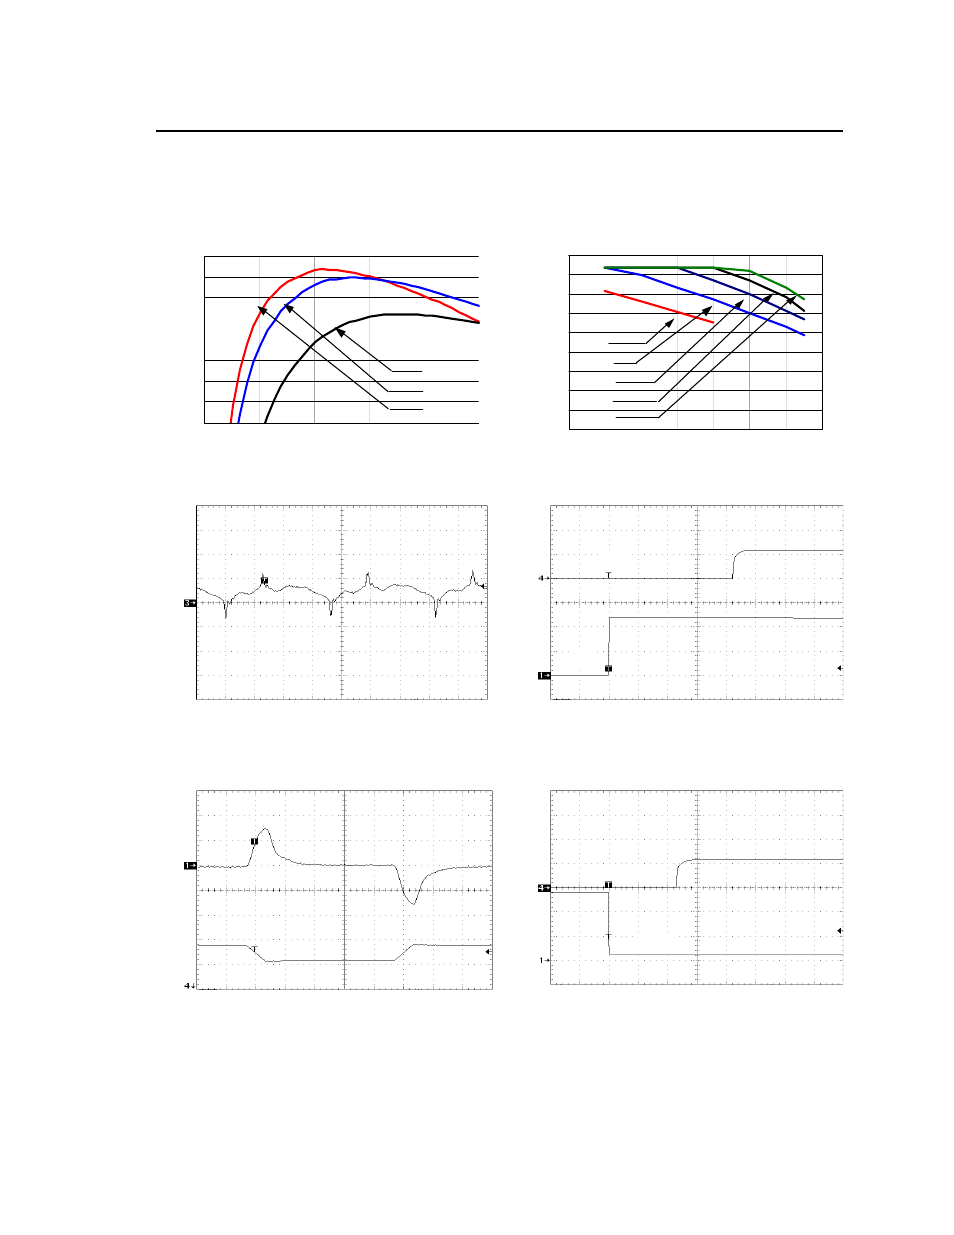
The following figures provide typical characteristics for the EQW025A0P1 (1.2V, 25A) at 25ºC. The figures are
identical for either positive or negative Remote On/Off logic.
EF
FI
CI
EN
C
Y
(
%
)
70
72
74
76
78
80
82
84
86
0
5
10
15
20
25
Vin=75V
Vin=36V
Vin=48V
OUTP
UT
CUR
RE
NT
, Io
(
A
)
0
3
6
9
12
15
18
21
24
27
20
30
40
50
60
70
80
90
200 LFM
300 LFM
400 LFM
NC
100 LFM
OUTPUT CURRENT, I
o
(A)
AMBIENT TEMPERATURE, T
A
O
C
Figure 1. Typical Converter Efficiency Vs. Output
current at Room Temperature.
Figure 4. . Derating Output Current versus Local
Ambient Temperature and Airflow
O
U
T
P
U
T
VOLTAGE
V
O
(V
) (20m
V/d
iv
)
IN
PU
T
V
O
L
T
A
G
E
O
UT
P
U
T
VO
LT
AG
E
V
On
/o
ff
(V
) (2
0V
/d
iv
)
V
O
(V
) (1
V
/d
iv
)
TIME, t (1
s/div)
TIME, t (5ms/div)
Figure 2. Typical Output Ripple and Noise (Vin
=48Vdc, Io = 25A).
Figure 5. Typical Start-Up with application of Vin (Vin =
48Vdc, Io = 25A).
OU
TPU
T
C
URR
E
N
T
OU
T
P
U
T
VOLTAG
E
I
O,
(
A
)
(1
0A
/d
iv)
V
O
(V
) (1
00
m
V
/d
iv
)
O
N
/OF
F
VO
LT
A
G
E
O
UT
P
U
T
V
O
LT
AG
E
V
On
/o
ff
(V
) (5
V
/d
iv)
V
O
(V
) (
1V/
div
)
TIME, t (100
s/div)
TIME, t (5ms/div)
Figure 3. Typical Transient Response to Dynamic
Load change Load from 50% to 75% to 50% of Full
load at 48 Vdc Input.
Figure 6. Typical Start-Up Using Remote On/Off,
negative logic version shown (Vin = 48Vdc, Io = 25A).