Characteristic curves, Continued) – GE Industrial Solutions EQW012-020-023-025 Series User Manual
Page 11
Data Sheet
October 5, 2013
EQW012/020/023/025 Series, Eighth-Brick Power Modules:
36 - 75Vdc Input; 1.2Vdc to 5Vdc Output; 12A to 25A Output
LINEAGE
POWER
11
Characteristic Curves
(continued)
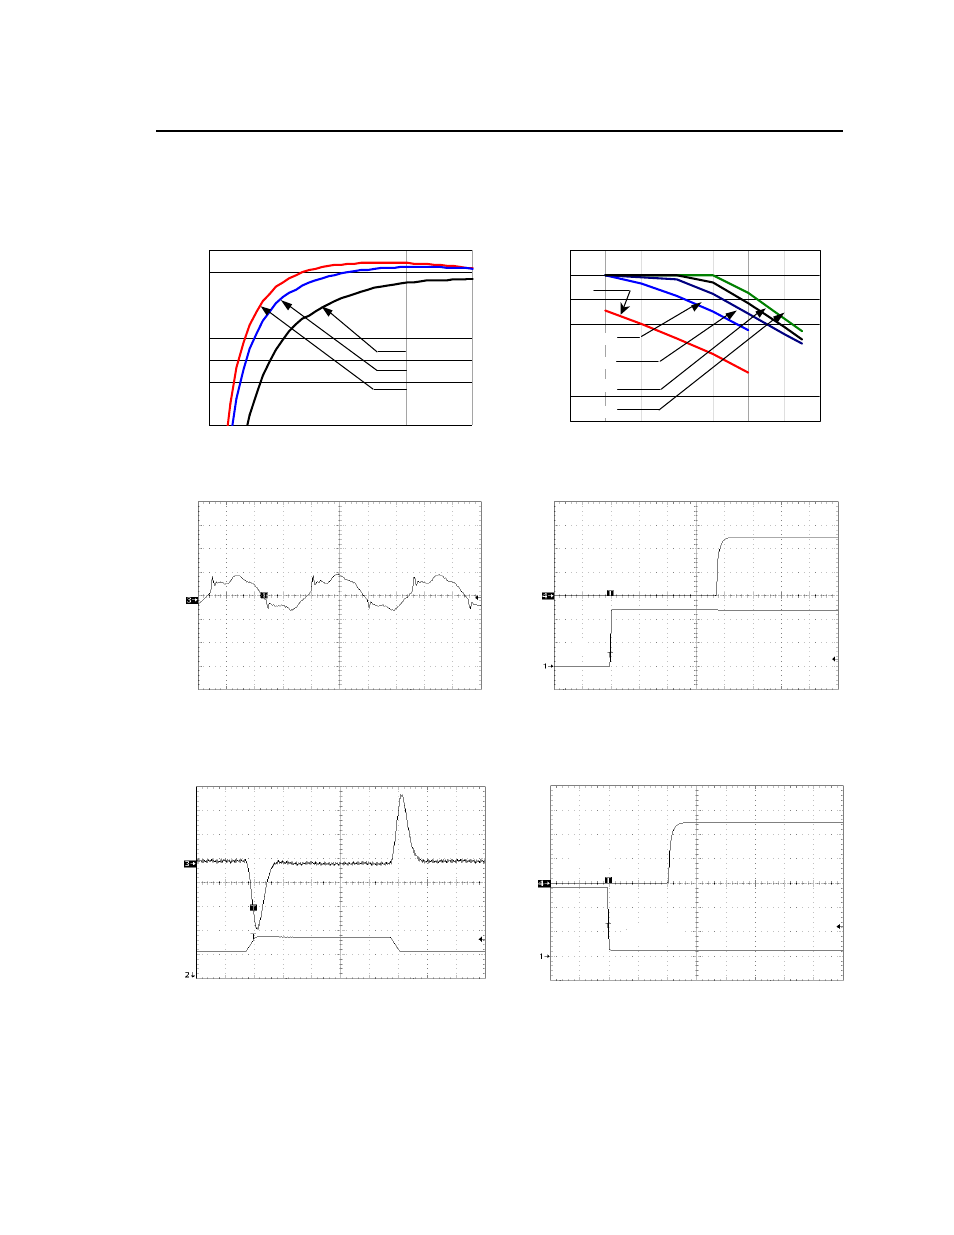
The following figures provide typical characteristics for the EQW012A0A (5.0V, 12A) at 25ºC. The figures are
identical for either positive or negative Remote On/Off logic.
EF
FI
CI
EN
C
Y
(
%
)
70
73
76
79
82
85
88
91
94
0
3
6
9
12
Vin=75V
Vin=36V
Vin=48V
OU
T
P
UT
CUR
RE
NT
, Io
(
A
)
0
2
4
6
8
10
12
14
20
30
40
50
60
70
80
90
200 LFM
300 LFM
400 LFM
NC
100 LFM
OUTPUT CURRENT, I
o
(A)
AMBIENT TEMPERATURE, T
A
O
C
Figure 31. Typical Converter Efficiency Vs. Output
current at Room Temperature.
Figure 34 . Derating Output Current versus Local
Ambient Temperature and Airflow
O
U
T
P
U
T
VOLTAGE
V
O
(V
) (2
0m
V/d
iv
)
IN
P
U
T
VO
LT
A
G
E
O
U
T
PU
T
VO
LT
A
G
E
V
On
/o
ff
(V
) (2
0V
/d
iv
)
V
O
(V)
(
1V/
di
v)
TIME, t (1
s/div)
TIME, t (5ms/div)
Figure 32. Typical Output Ripple and Noise (Vin
=48Vdc, Io = 12A).
Figure 35. Typical Start-Up with application of Vin (Vin
= 48Vdc, Io = 12A).
OU
TPU
T
CURR
E
N
T
OU
TP
U
T
VOLTAG
E
I
O,
(A
) (1
0A
/di
v)
V
O
(V
)
(100mV
/di
v)
O
N
/OF
F
VO
LT
A
G
E
O
UT
P
U
T
VO
LT
AG
E
V
On
/o
ff
(V
) (5
V
/d
iv
)
V
O
(V
) (
1V/
div
)
TIME, t (100
s/div)
TIME, t (5ms/div)
Figure 33. Typical Transient Response to Dynamic
Load change Load from 50% to 75% to 50% of Full
load at 48 Vdc Input.
Figure 36. Typical Start-Up Using Remote On/Off,
negative logic version shown (Vin = 48Vdc, Io = 12A).