5 the spectral region, 6 the plotlegend dialog box – Ocean Optics DTS User Manual
Page 32
Chapter 4
4-8
Polychromix DTS
TM
Near-Infrared Spectrometer
Operator’s Manual
Document Number 04-91-0201-00 Rev A
4.5
The Spectral Region
The spectral region presents the data that was collected.
If desired, one can expand (zoom) a region of the spectrum by placing the
mouse on one corner of the desired region to be enlarged, clicking the left
button and dragging the mouse to the opposite corner and then releasing the
mouse button. To return to the auto-scaled plot, click the right button on the
mouse.
The Autoscale command (Section 4.4) can be used to expand/contract the
spectrum so that it appears full scale in the spectral region.
The colors of each element of the window can be selected as described in
Section 4.3.2 and the color of the active spectrum can be selected as
described in Section 4.4.
The bottom line of the window is a status bar and provides information to the
operator.
•
The left field indicates the Com Port that is employed for the
spectrometer. If the spectrometer is not connected, the legend No Device
Found will be presented.
•
The center field is used if the multiple scan feature is employed. The
number of remaining scans and the time until the next scan will be
indicated.
•
The right field will indicate the position of the cursor if the mouse is in the
spectral region (e.g. X:1356.2, Y:0.02433).
4.6
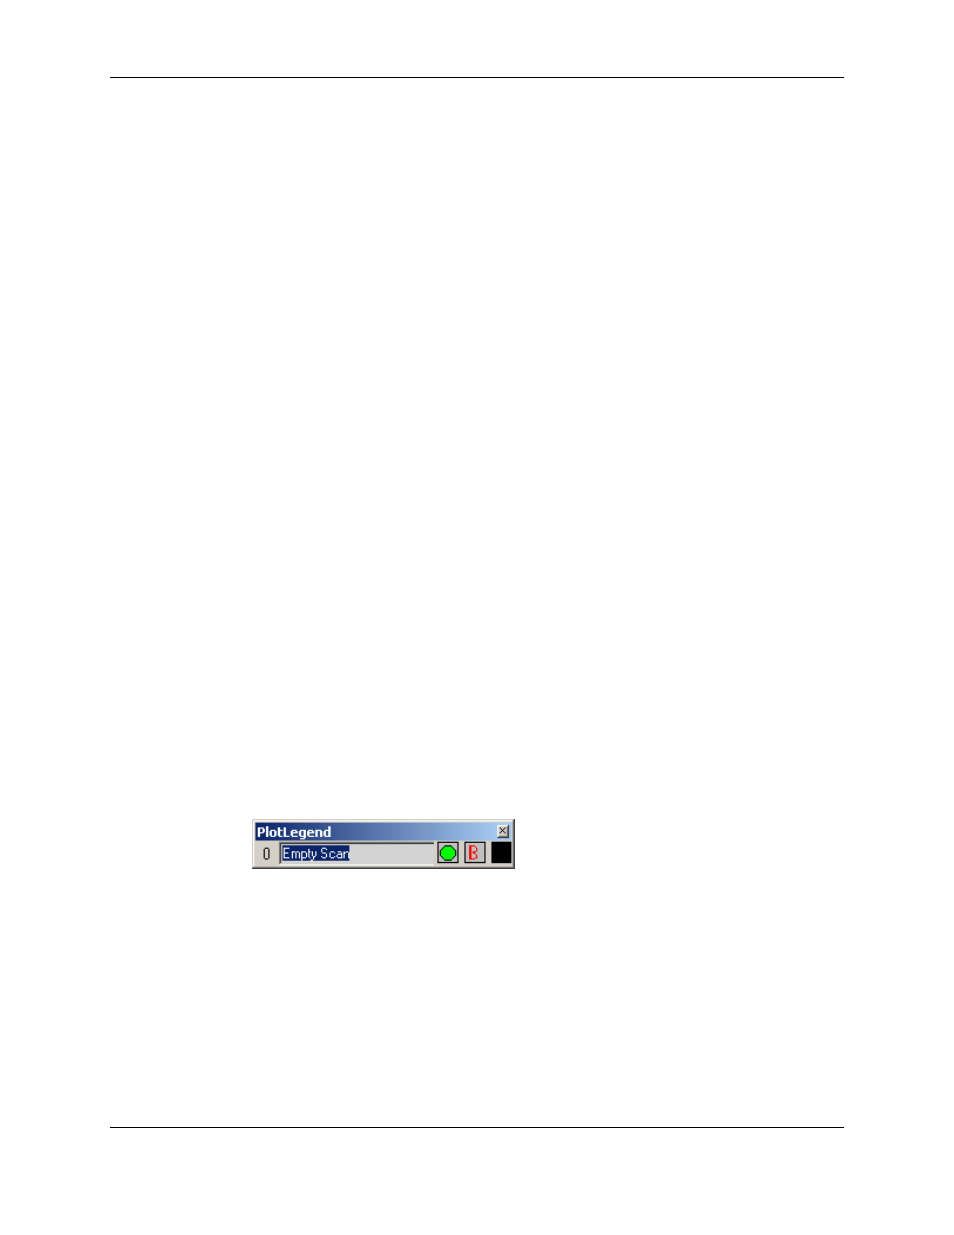
The PlotLegend Dialog Box
The PlotLegend dialog box is used to indicate the status of the active
registers. Figure 4-9 shows the dialog box when the instrument is started.
Figure 4-9: The Plot Legend Dialog Box