Ocean Optics DTS User Manual
Page 27
The SpectralCode Application Program
Polychromix DTS
TM
Near-Infrared Spectrometer
4-3
Operator’s Manual
Document Number 04-91-0201-00 Rev A
Open File - Accesses a standard Windows dialog box to open an existing
data file and presents the spectrum.
Save File - Presents a standard Windows dialog box to save the active
spectrum. The file is saved as a comma separated Windows Excel file and
can be used for further data processing and/or presentation. If you want to
open the file in Excel, select All Files for the Files of Type field on the Open
dialog box.
The format of the file name is x_yyyymmdd_hhmmss.csv, where x can be
any alphanumeric information you wish to assign, yyyymmdd indicates the
date of collection and hhmmss indicates the time of collection. As an
example, a typical file name might be sugar_20050504_081245, which was
collected at 8:12:45 AM on May 5, 2005. In this instance, the operator
entered the file name sugar; the date and time information is automatically
added to the file name.
Print Plot - Presents a dialog box to enter the name of the spectrum and any
comments that you want to annotate to the spectrum. After entering the
desired information, the annotated plot can be printed by pressing the printer
icon in the upper left corner of the window. The plot is printed by the printer
that is indicated as the default printer in Windows.
Copy - Copies the present window for pasting into another application (e.g. a
word processor). A printer compatible plot is presented.
Exit - Closes the program.
4.3.2
The Settings Menu
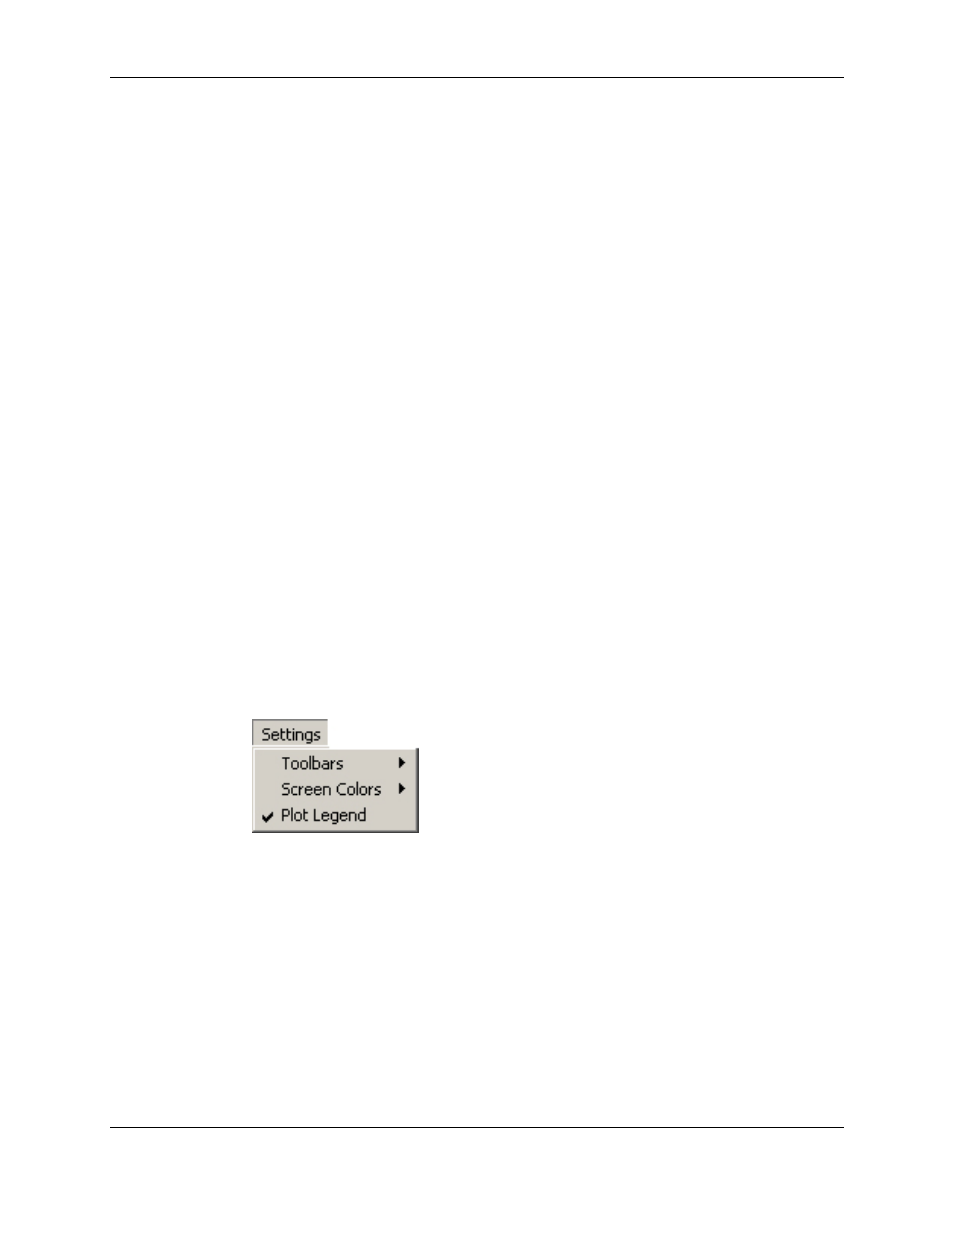
The Settings menu (Figure 3-4) is used to change the nature of the window to
meet the specific desires of the user.
Figure 4-4: The Settings Menu
Toolbars - Used to indicate if the Data Collection and Spectral Manipulation
tool bars should be presented in the window. A detailed discussion of the
toolbars is presented in Section 4.4).
Screen Colors - Used to change the color of various elements of the main
window including the background, the chart grid, the axes and the axes
labels. Each selection presents the standard Windows color palette.
Plot Legend - Presents/removes the PlotLegend window (see Section 4.6).