beautypg.com
38
LOggINg
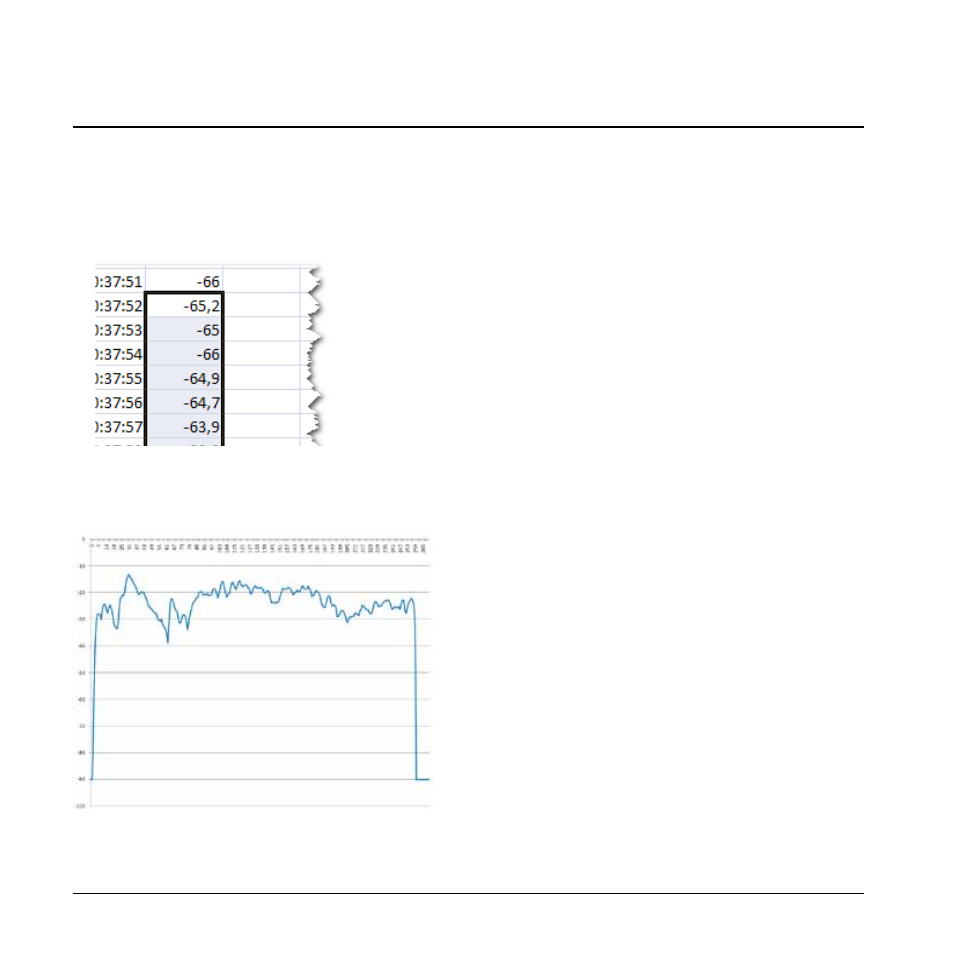
You may prefer using Excels “Line Chart” function to view
and analyze the data.
- Select the range Loudness Data you want to see in a
Line Chart.
- Now select “Insert - Line” and the type of line you
want to see.
Example: