Bolus tracking – Siemens SOMATOM SENSATION CARDIAC A60 User Manual
Page 55
55
Bolus Tracking
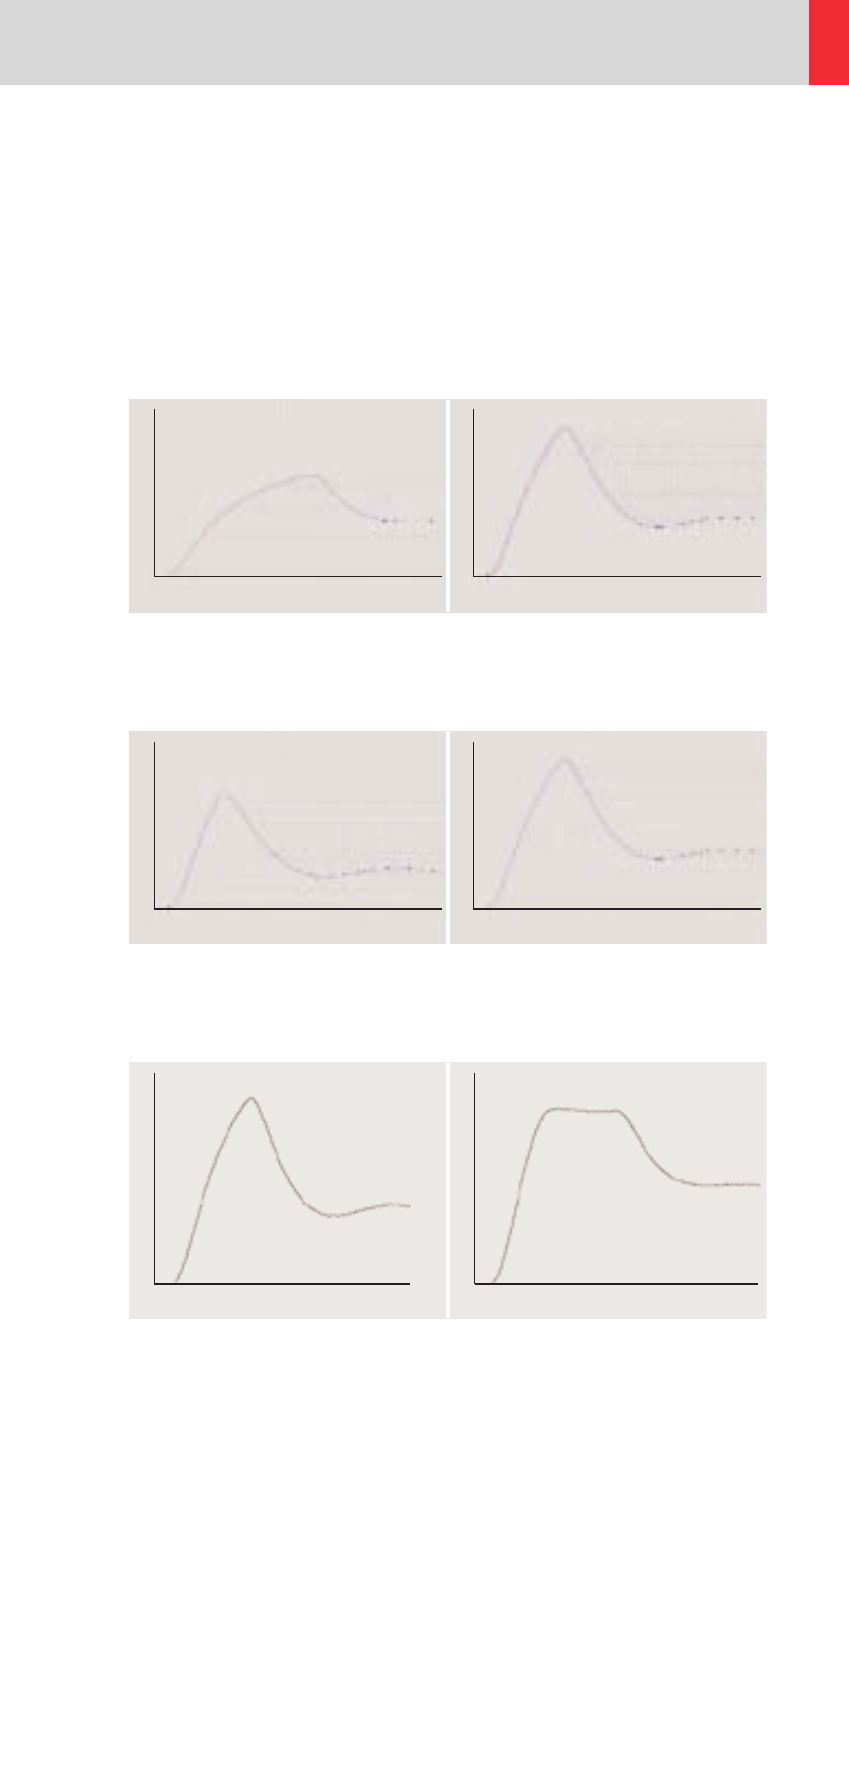
Aortic time-enhancement curves after i. v. contrast
injection (computer simulation*).
All curves are based on the same patient parameters
(male, 60-year-old, 75 kg).
Fig. 2a: 2 ml/s,
120 ml, 300 mg I/ml
Fig. 2b: 4 ml/s,
120 ml, 300 mg I/ml
Fig. 3a: 80 ml,
4 ml/s, 300 mg I/ml
Fig. 3b:120 ml,
4 ml/s, 300 mg I/ml
Fig. 4a: Uni-phase
140 ml, 4 ml/s,
370 mg I/ml
Fig. 4b: Bi-phase
70 ml, 4 ml/s, plus 70 ml,
2 ml/s, 370 mg I/ml
*Radiology 1998; 207:647-655
Relative
Enhancement
[HU]
Time [s]
0
20
40
60
80
100
120
300
250
200
150
100
50
0
Relative
Enhancement
[HU]
Time [s]
0
20
40
60
80
100
120
300
250
200
150
100
50
0
Relative
Enhancement
[HU]
Time [s]
0
20
40
60
80
100
120
400
350
300
250
200
150
100
50
0
Relative
Enhancement
[HU]
Time [s]
0
20
40
60
80
100
120
300
250
200
150
100
50
0
Relative
Enhancement
[HU]
Time [s]
0
20
40
60
80
100
120
300
250
200
150
100
50
0
Relative
Enhancement
[HU]
Time [s]
0
20
40
60
80
100
120
300
250
200
150
100
50
0