Appendix, Technical guide vcm controller 56, Oe275 suction pressure transducer testing – Orion System VCM Controller User Manual
Page 56
Technical Guide
VCM Controller
56
Appendix
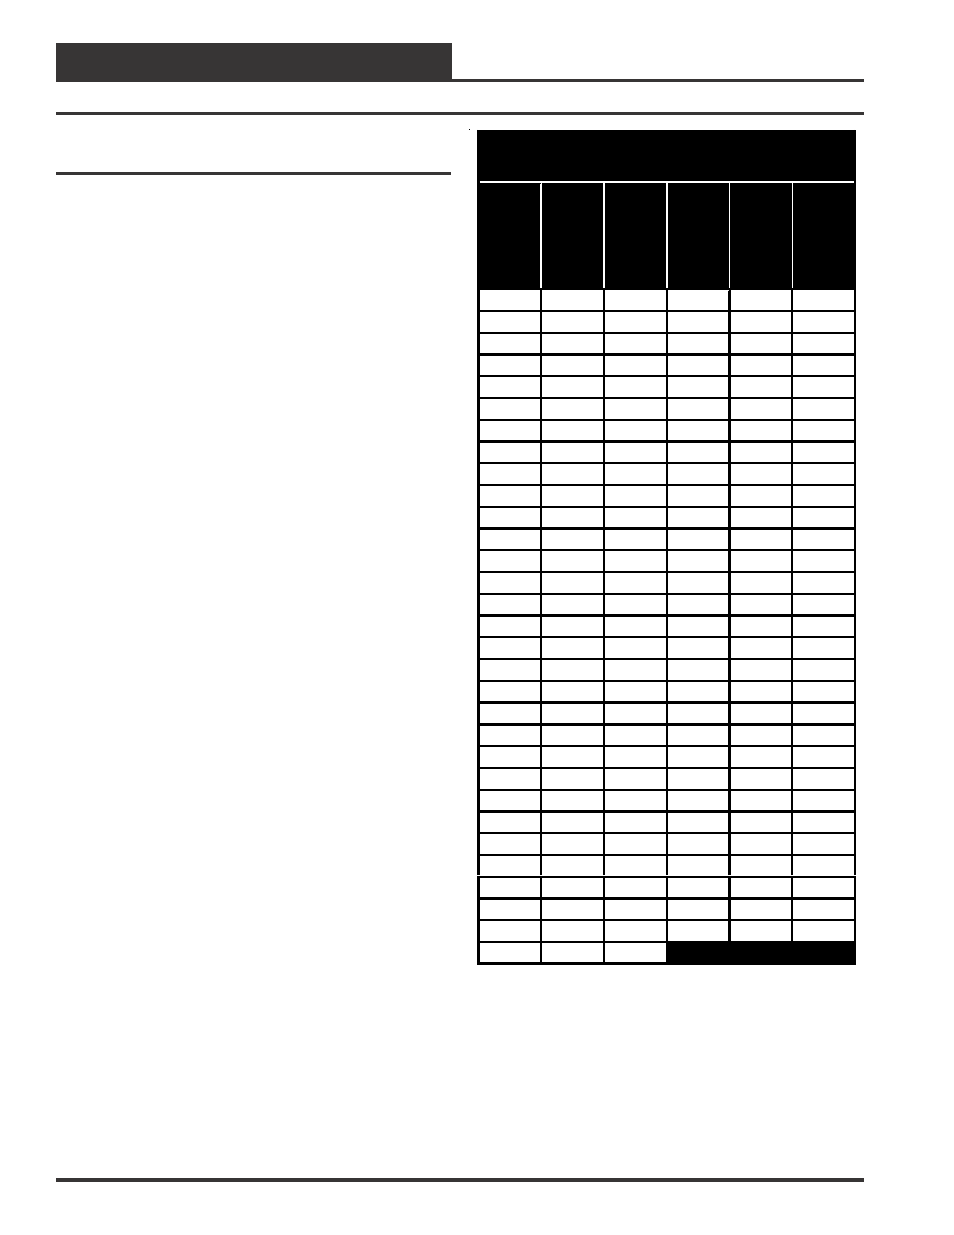
OE275 Suction Pressure Transducer
Coil Pressure – Temperature – Voltage Chart
Tem
p
e
rat
u
re
°
F
P
res
sure
PS
I
Si
g
n
a
l
D
C
V
o
lts
Tem
p
e
rat
u
re
°
F
P
res
sure
PS
I
Si
g
n
a
l
D
C
V
o
lts
20
43.03
1.19
51
85.79
1.88
21
44.21
1.21
52
87.54
1.91
22
45.40
1.23
53
89.30
1.93
23
46.59
1.25
54
91.06
1.96
24
47.77
1.27
55
92.82
1.99
25
48.96
1.29
56
94.58
2.02
26
50.14
1.31
57
96.34
2.05
27
51.33
1.32
58
98.10
2.08
28
52.52
1.34
59
99.86
2.10
29
53.70
1.36
60
101.62
2.13
30
54.89
1.38
61
103.60
2.16
31
56.25
1.40
62
105.58
2.20
32
57.61
1.43
63
107.56
2.23
33
58.98
1.45
64
109.54
2.26
34
60.34
1.47
65
111.52
2.29
35
61.70
1.49
66
113.50
2.32
36
63.06
1.51
67
115.48
2.35
37
64.42
1.53
68
117.46
2.39
38
65.78
1.56
69
119.44
2.42
39
67.14
1.58
70
121.43
2.45
40
68.51
1.60
71
123.65
2.49
41
70.06
1.63
72
125.87
2.52
42
71.61
1.65
73
128.09
2.56
43
73.16
1.68
74
130.31
2.59
44
74.71
1.70
75
132.53
2.63
45
76.26
1.73
76
134.75
2.66
46
77.82
1.75
77
136.97
2.70
47
79.37
1.77
78
139.19
2.74
48
80.92
1.80
79
141.41
2.77
49
82.47
1.82
80
143.63
2.81
50
84.02
1.85
OE275 Suction Pressure Transducer Testing
Use the voltage column to check the Suction Pressure Transducer while
connected to the VCM Controller. The VCM Controller must be pow-
ered for this test. Read voltage with a meter set on DC volts. Place the
negative lead from the meter on a ground (GND) terminal located on
the VCM’s 12-pin terminal block. Place the positive lead from the meter
on the AIN5 terminal located on the VCM’s 12-pin terminal block.
OE275 Suction Pressure Transducer
Testing
The Evaporator Coil Temperature is calculated by converting the Suc-
tion Pressure to Temperature. The Suction Pressure is obtained by us-
ing the OE275 Suction Pressure Transducer which is connected into the
Suction Line of the Compressor. See the OE275 Suction Pressure Trans-
ducer, Pressure, Temperature and Voltage Chart. The chart shows a tem-