Display task bar, Vibration data display – Measurement Computing eZ-Balance rev.9.0 User Manual
Page 22
3-4 Windows, Buttons, and Menus
969391
eZ-Balance
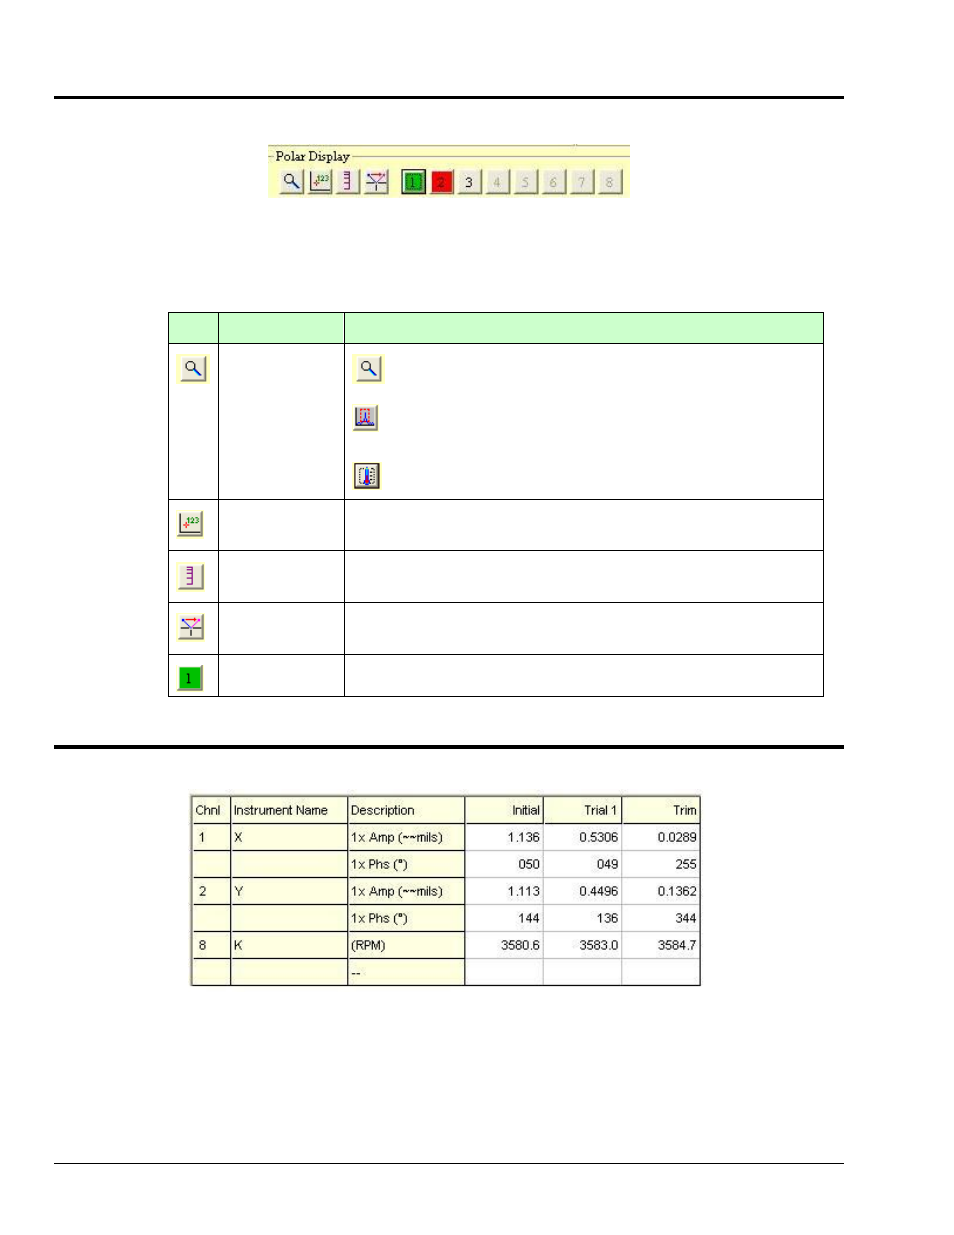
Display Task Bar
Plot Display Task Bar
The Plot Display task bar is located at the top edge of the Polar Display panel; but applies to the Time and
Spectra Displays in addition to the Polar Display. The task bar is used to select the active channels to be
displayed and to adjust display parameters in regard to scale, and as to whether or not runout compensation
should be applied. The task bar includes a button for turning the annotation function on or off.
Button
Function and/or Comment
Scale
3 modes
Auto Scale – Automatically sets the scale.
User Scale – Left-click near the high or low ends of the x and/or
y axis to access a numeric field, which allows you to enter new
maximum and minimum values.
Instrument Scale - sets the scale according to the instrument
Data
Annotation
For the chart displays, this button is used to turn annotation (x,y data
values) on or off.
Log Scale
The Log Scale button applies to the Spectrum Display. The button
toggles the scale from Linear to Logarithmic and visa versa.
Apply Runout
This button should be clicked when the machine is running at full speed
so that runout compensation can be applied.
Channels
(8 buttons)
These buttons are used to select (or deselect) the input channel(s).
Vibration Data Display
Vibration Data Display
The Vibration Data table shows the vibration data for each balance run. The data can be entered manually,
or collected on-line through the data acquisition device.
The vibration data is plotted in the Polar, Time, and Spectra displays.