Measurement Computing DIAdem User Manual
Page 36
34 DIAdem® VIEW: Viewing, Measuring & Editing Data
04-19-00
DIAdem®
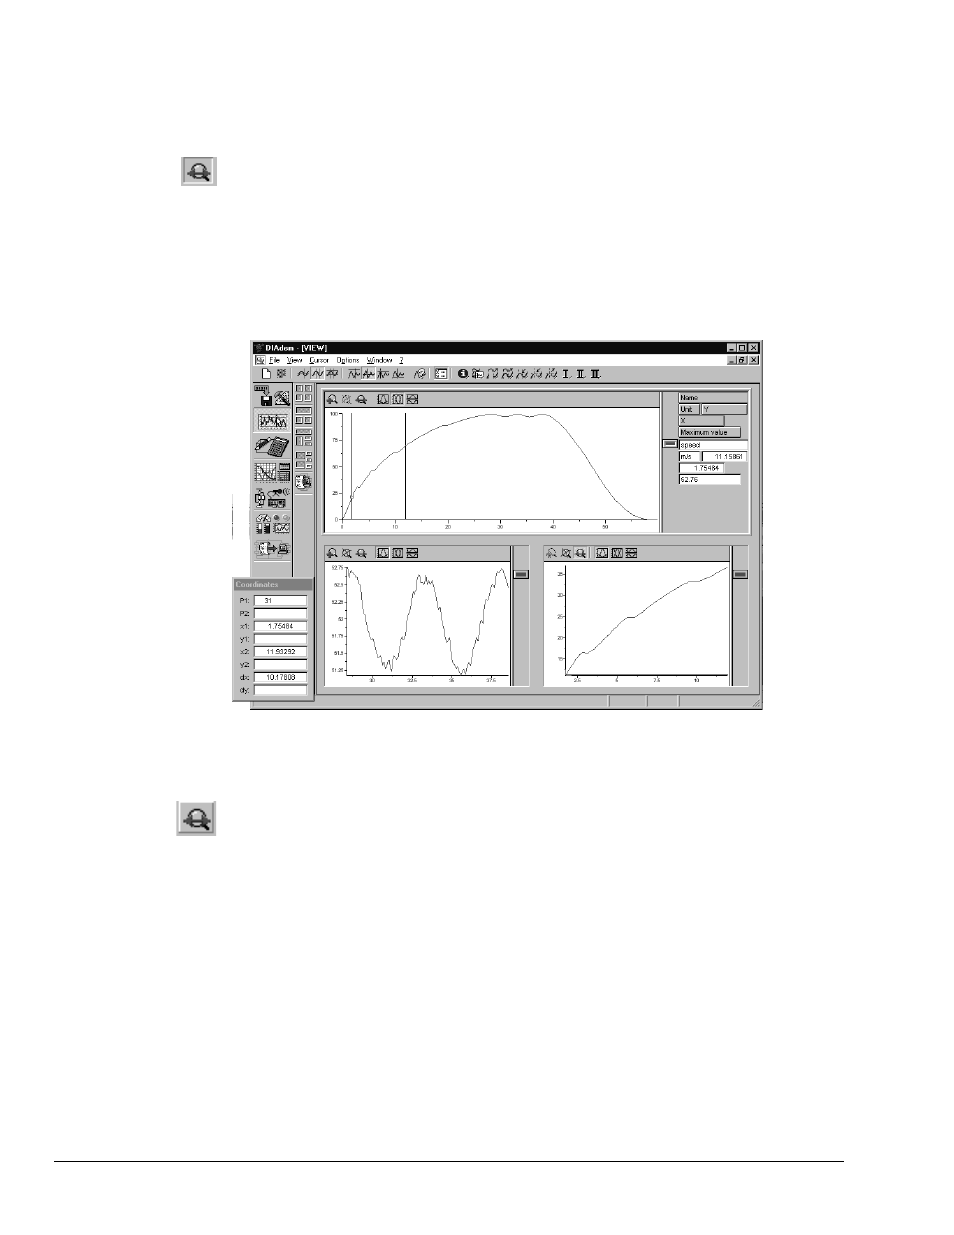
Scrolling Through Graph Segments
While the zoom feature allows you to examine individual enlarged graph segments statically, the
scroll feature allows you to move along the enlarged graph. It is as if the graph were scrolled
along under a magnifying glass.
Turning on scrolling
Using the graph symbol, copy the red graph into the lower right-hand axis system. If no band
cursor is active, choose one. Widen the segment width as needed. Then activate scrolling in the
axis-specific Tool bar.
Now you can let the speed graph move through by holding down the left mouse button while
moving the mouse cursor horizontally.
Since the graphics cursor is always visible in axis systems with graphs, the graphics cursor in
passive systems follows along correspondingly as long as the X value regions are equal. If
zooming is active in an axis system, the graph section that has been set there remains unchanged!
Scrolling through a segment
n the lower right-hand axis system
Apart from directly moving the graph with the mouse, the so-called scrollbar can also be used for
moving. For this purpose, the horizontal scrollbar should be activated in the context menu. Now,
the graph can also be moved by moving the scrollbar. If you are working with a frame cursor, it is
sensible to insert the vertical scrollbar.
Scrolling off
Scrolling can be de-activated at any time. In contrast to zoom, the last segment viewed stays in
place; it is “frozen.” Enlargement can be undone with the Zoom off symbol, since zooming also
occurs when scrolling is turned on.
When you activate another axis system, zooming and scrolling retain their settings in the old axis
system. This means in terms of the example above that you can place the band cursor in the upper
axis system over the speed graph and view the graph enlarged in the lower right-hand axis
system.