Viewing data as graphs – Measurement Computing DIAdem User Manual
Page 30
28 DIAdem® VIEW: Viewing, Measuring & Editing Data
04-19-00
DIAdem®
Viewing Data as Graphs
Load data in DIAdem
®
-DATA
The data file “Calc3.dat” has been used for the screen display on the first page of the chapter.
If you have modified the example data set in the DIAdem
®
-DATA device, which is loaded
automatically, load the data file “Data.dat” from the user data path (...\diadem\demo\dat).
DIAdem
®
VIEW
To work with DIAdem
®
VIEW, click on the corresponding button in the Device bar.
The DIAdem
®
VIEW Working area contains several axis systems in which data from the Data
area may be viewed as graphs. Note that the active axis system is displayed with a highlighted
frame while the axis of the passive widows does not have a highlighted frame. The cursor can
be moved with the mouse through the active axis system, whereas it simply “follows along” in
the passive system when the value range is the same.
Graph Definitions:
Entering and Deleting Graphs in an Axis System
To enter a graph into an axis system, coordinate any set of X and Y channels in the graph
definition. Of course several graphs may be entered into an axis system.
Double-clicking on an axis
system opens the graph definition
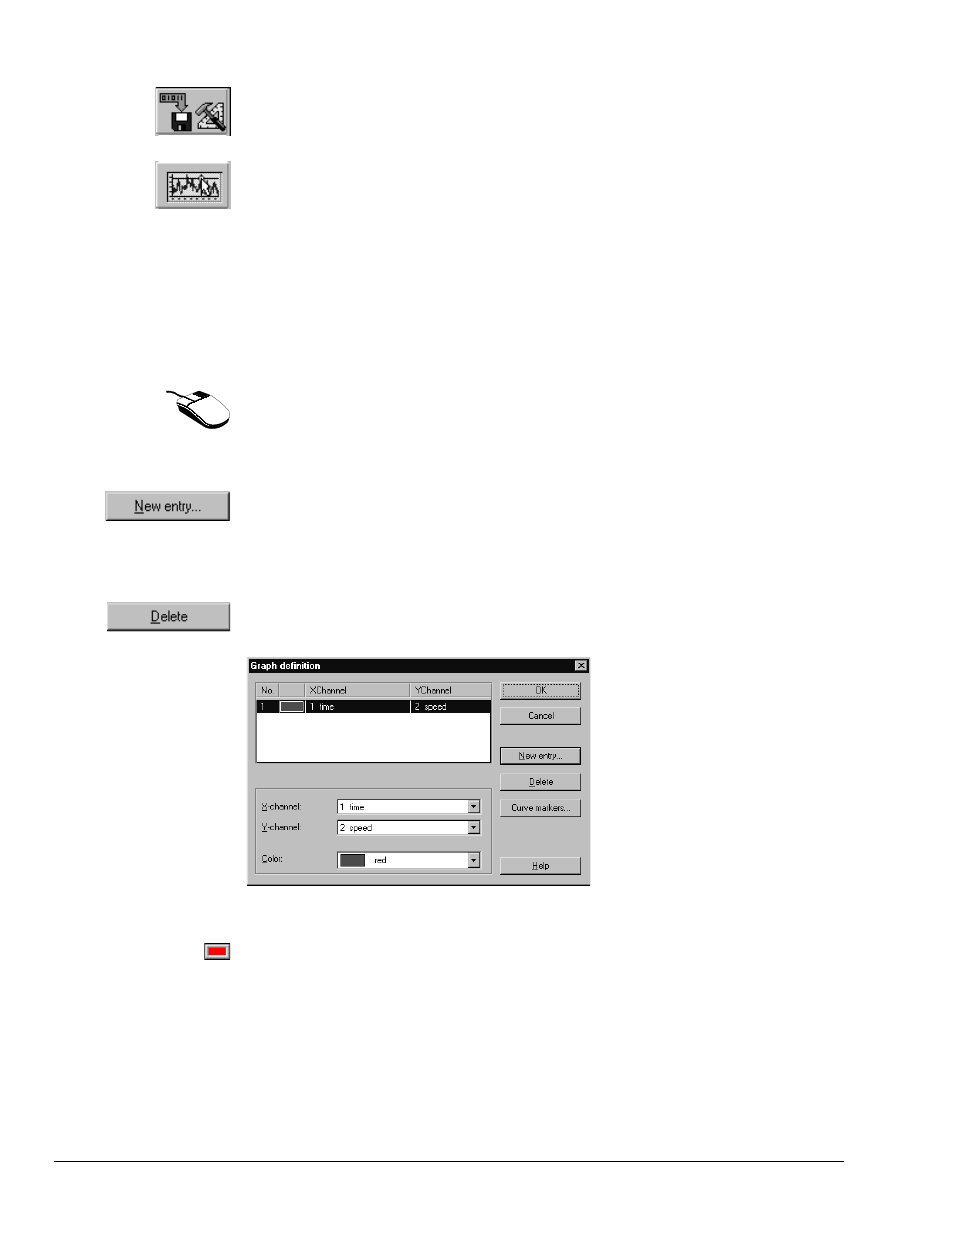
Double-click (click twice in rapid succession) on the upper axis system. The Graph definition
dialog box appears.
The Graph definition gives you an overview of previously defined graphs in the active axis
system. In our example this line is still blank.
Entering new graph(s)
To specify the data channels you wish to display, click on the “New entry...” button. Choose
the data channel "Time" as the X channel and “Speed” as the Y channel. Exit the sub-dialog
box with "OK".
Note:
Two or more graphs can be defined at once for the same basis. Use the X channel, and mark
the two Y channels with the right mouse key. After “OK”, two graphs are entered in the list.
Deleting graph
This new graph entry now appears in the overview in the main dialog box. If you wish to, you
can later delete the graph from the axis system with Delete.
The Graph definition dialog box
Graph points can be emphasized with colored symbols, as it will be shown in
DIAdem
®
-GRAPH, using the “Graph markers“.
Graph symbol
After you exit the Graph definition with OK, the graph is entered into the active axis system. At
the same time, the corresponding graph symbol appears beside the axis system, a small
rectangle in the corresponding graph color, red.