Using the cursor position to measure a graph – Measurement Computing DIAdem User Manual
Page 31
DIAdem®
04-19-00
DIAdem® VIEW: Viewing, Measuring & Editing Data 29
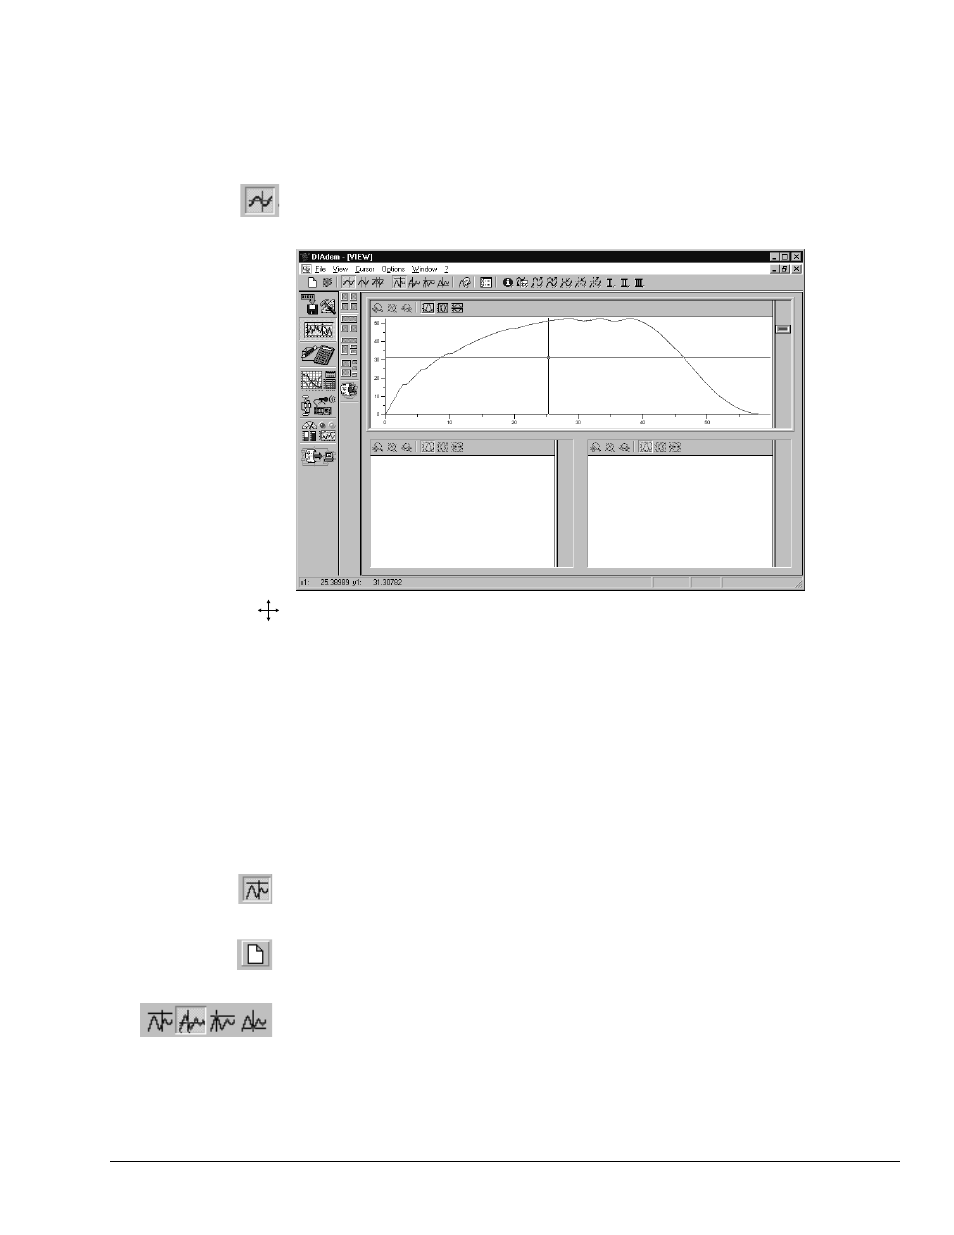
Using the Graphics Cursor in DIAdem View
A number of graphics cursors are available to move or measure one or more graphs. You can
choose from a crosshair, frame or band cursor. Use the mouse to access the cursor (in the active
axis system only). The graphics cursor follows along passively in the other axis systems to the
extent the range of values agree.
Crosshair cursor
The crosshair cursor consists of horizontal and vertical cursor lines which can be moved
independently. The point of intersection defines the X and Y coordinates, which appear in the
Status line as X
1
, and Y
1
.
The crosshair cursor,
used for example to
measure graph coordinates
Positioning the crosshair cursor
Whenever you press the left mouse button and hold it down in the active axis system, a small
cross appears. When you move the mouse, the crosshair cursor “snaps” to the mouse cursor
coordinates and follows any further mouse movements.
Note:
If you move the mouse over one of the crosshairs, the graphics cursor changes into a horizontal
(
√) or vertical arrow (⋅). At this point you can hold the left mouse button down and move the
cursor line horizontally or vertically.
Using the Cursor Position to Measure a Graph
The intersection point of the crosshair cursor is surrounded by a small square. This square is used
to follow the path of the graph. The other cursor types also use this “measuring square”.
The intersection point of the crosshair cursor is surrounded by a small square. This square is used
to follow the path of the graph. If you choose another of the cursor types, the “measuring square”
will remain at an intersection point.
Free Cursor
By default, the graphics cursor is set to move freely, allowing the cursor to be moved anywhere in
the active axis system. If you select other positioning settings, certain graph points will be
sampled and selectively displayed in the Status line.
Delete all data
The whole data area is emptied with the “empty page” symbol in the tool bar.
In the following, the example file “Data.dat” should be loaded from the hard disk, because this
data is used in the following chapters of the manual.
Graphics cursor
Choose the graphics cursor in the command line. When you move the mouse, the crosshair stays
on the graph and moves from point to point along it. In this manner you can display coordinates
for any point along the graph.
Note:
The Maxima-cursor and Minima-cursor can be switched on. When on these settings, the
graphics cursor moves from one extreme value to the next.