Measurement Computing DIAdem User Manual
Page 32
30 DIAdem® VIEW: Viewing, Measuring & Editing Data
04-19-00
DIAdem®
Graph Legend:
Displaying the Axis-Oriented Display
The legend can be displayed next to any axis system.
Displaying legends
Move the mouse cursor over the right border of the axis system. When the table cursor appears
with two vertical lines, hold the left mouse button down. Then move the legend off to the left.
The name of the Y data channel, the unit and, with the corresponding graphics cursor, the X and
Y coordinates are shown in the legend. It is possible to add additional displays and define their
arrangement.
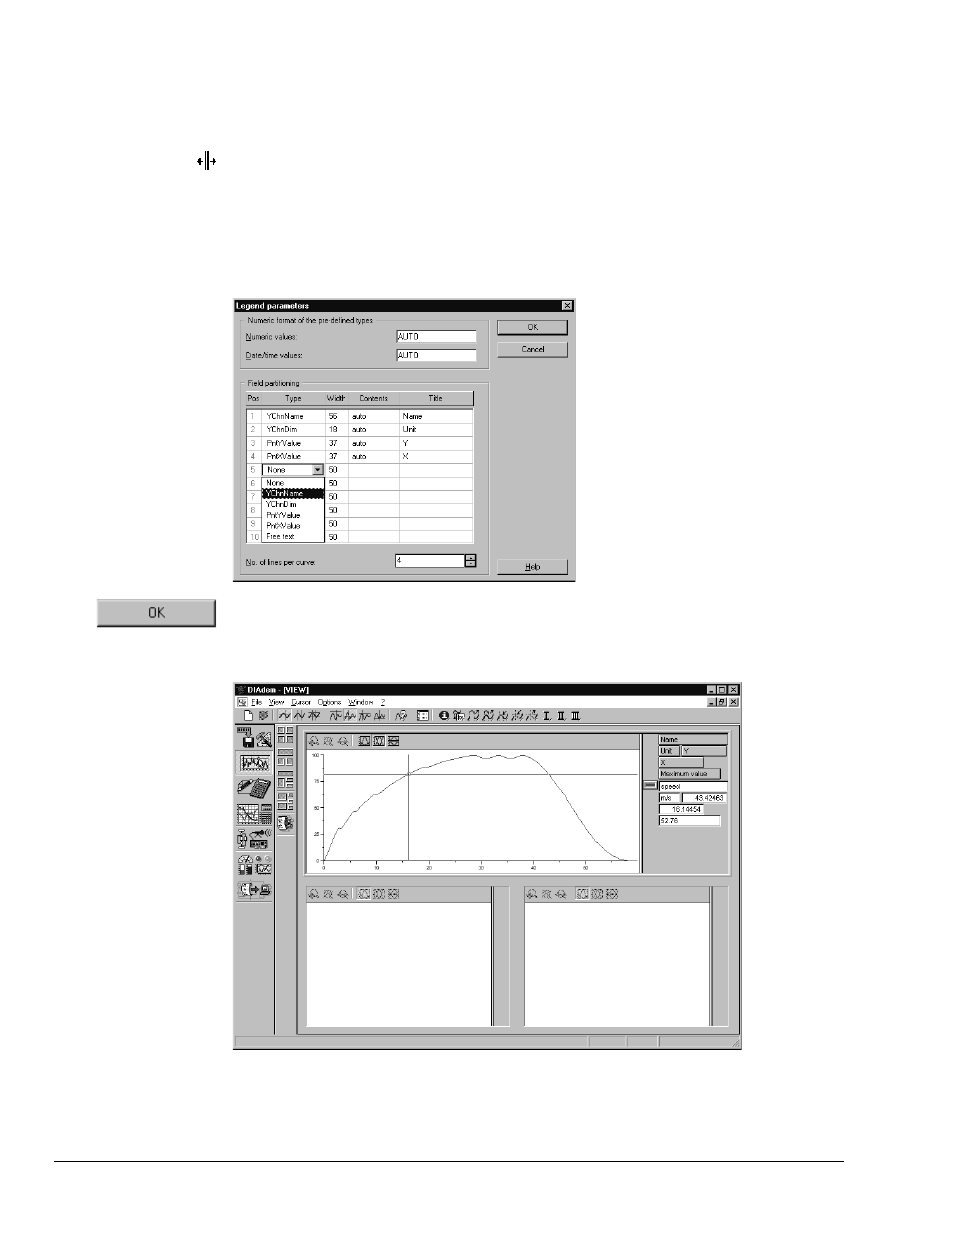
Double click on the legend and the parameters dialog box appears. Click on “Type” in the 5
th
line and select “Free Text“.
The form of the coordinate
display can be changed.
Close the dialog with “OK”.
Now, the channel name, the channel unit, the maximum value are displayed in the legend, as well
as the graph coordinates of the graphics cursor position, which are updated continuously.
Legend with graph data
as well as the maximum value
as the result of a formula