Measurement Computing DIAdem User Manual
Page 18
16 DIAdem – The PC Workshop
04-19-00
DIAdem®
Functions
Part of Function bar for 2D axis
systems in DIAdem
®
GRAPH
When a group symbol is activated, the corresponding Function bar opens up horizontally.
Executable functions are for example choosing an axis system and tables in the optional
DIAdem
®
GRAPH device, or choosing mathematical functions in the optional DIAdem
®
CALC device.
If you have the optional DIAdem
®
GRAPH device, choose one of the various 2D axis systems
in by clicking on the corresponding symbol in the Function bar.
The selected axis system is indicated in the upper left-hand corner of the Working area.
The function bar is the same in all the DIAdem
®
devices. Autosequences that are used
frequently can be assigned to these symbols and are thus available in all the devices.
The Working Area
When you select a device the Working area is automatically filled with a pattern. The same
procedure is always used for working with objects: a left-button mouse click is used to
activate, left double-click to set parameters and right mouse click to open context menus.
Mouse pointer
If you have the optional DIAdem
®
GRAPH device,
c
lick on one of the 2D axis systems.
Marking a frame around an object
You will notice light gray marking at the corners and at the middle of each side of the active
axis system. If you click inside the markings again and hold the left mouse button down, you
can move the axis system.
When you “pull” on one of the marks, the axis system increase in size correspondingly. You
can pull by clicking with the mouse and holding the left button down while you move the
mouse. If you pull the marks on the sides, the axis system will increase in size horizontally or
vertically. If you pull on a corner mark, you will zoom the entire axis system.
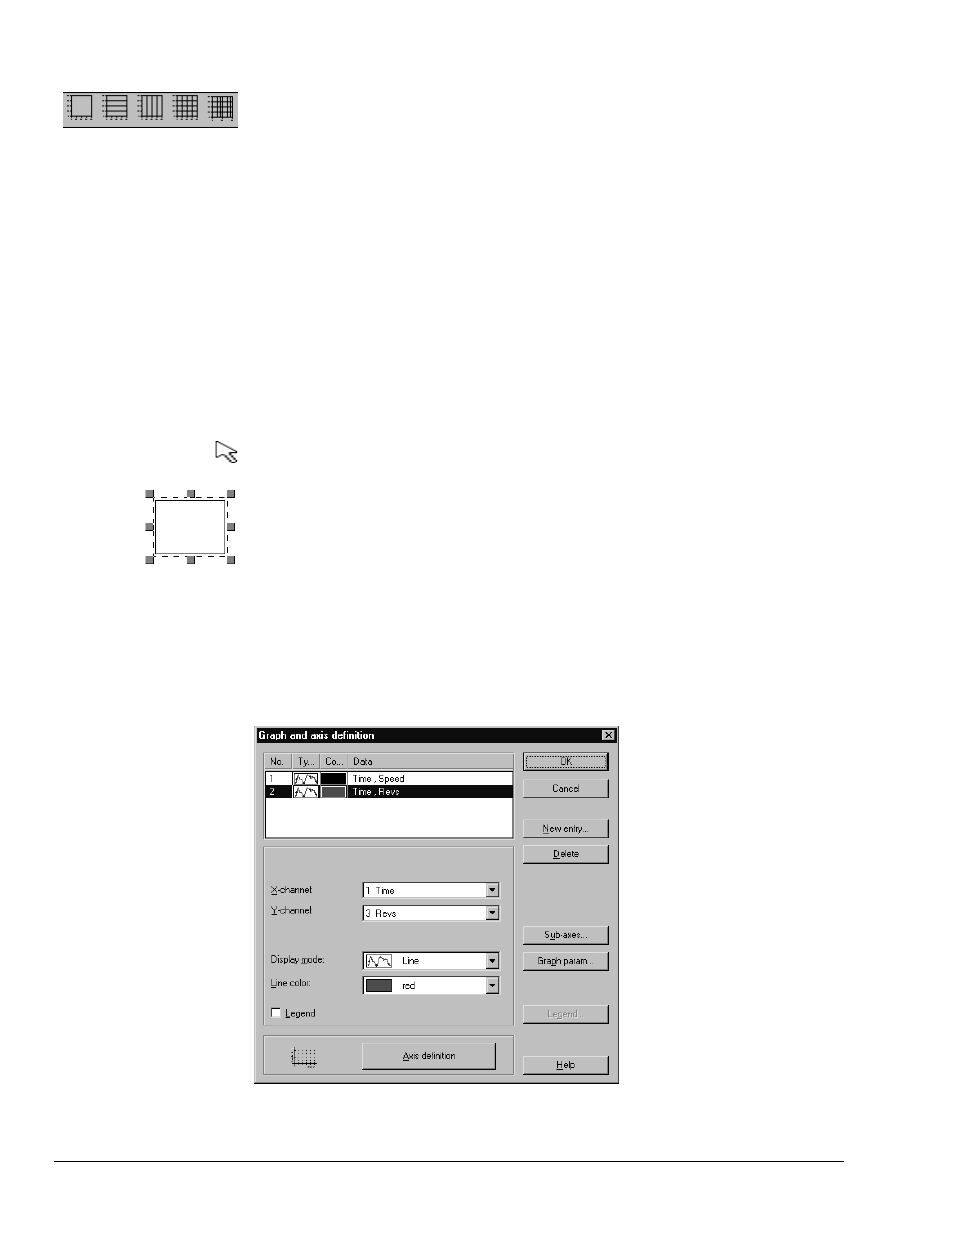
Dialog Boxes
Generally dialog boxes are used to associate data with objects such as axis systems or tables,
or to set properties such as line style and color.
All settings for objects are
handled in dialog boxes.
To access graph and axis definitions in DIAdem
®
-GRAPH, double-click on the axis system
in which you wish to represent the data.