Measurement Computing DIAdem User Manual
Page 19
DIAdem®
04-19-00
DIAdem® – The PC Workshop 17
E
ntering a new graph
To enter a graph, use the New entry button. At this point it will be sufficient to specify from the list of
available data channels an X channel to represent data values on the X axis and a Y channel to represent
corresponding values on the Y axis. Exit the sub-dialog box and the main dialog box with the OK button.
Note:
In the “graph entries heading” of above mentioned dialog box , the word “Color” is not complete [it appears
as “Co…”]. As soon as the mouse cursor crosses the vertical line separating the columns "F..." and "Data,"
the cursor appears as parallel lines with arrows to the left and the right. You can use this cursor to expand
the column, allowing you to read "Color" [instead of “Co…”].
Graph and axis definition is a rather complicated example of a dialog box, but it illustrates well the concept
of hierarchy in dialog boxes.
Basic options that are often changed are at the top of the dialog box hierarchy. In the graph and axis
definition, for example, a quick glance reveals which data channels are represented and how. These can be
changed directly on the top layer.
Less common options are located one layer “deeper“ to allow room for the essential ones. They can be
reached by a button. Standard features such as OK, Cancel, Delete, Change, and Close are also accessed by
buttons. The Help button is always in the bottom right-hand corner. It provides explanations of the
individual dialog parameters.
Default Settings for Functions
The properties of any object can be changed at any time and maintained in a diagram or block diagram (see
the explanation of dialog boxes above). These settings, however, apply only to the object at hand or the
mathematical function which has just been called. The next time the mathematical function is called, the
default setting will appear again. To change settings permanently, use Default setting.
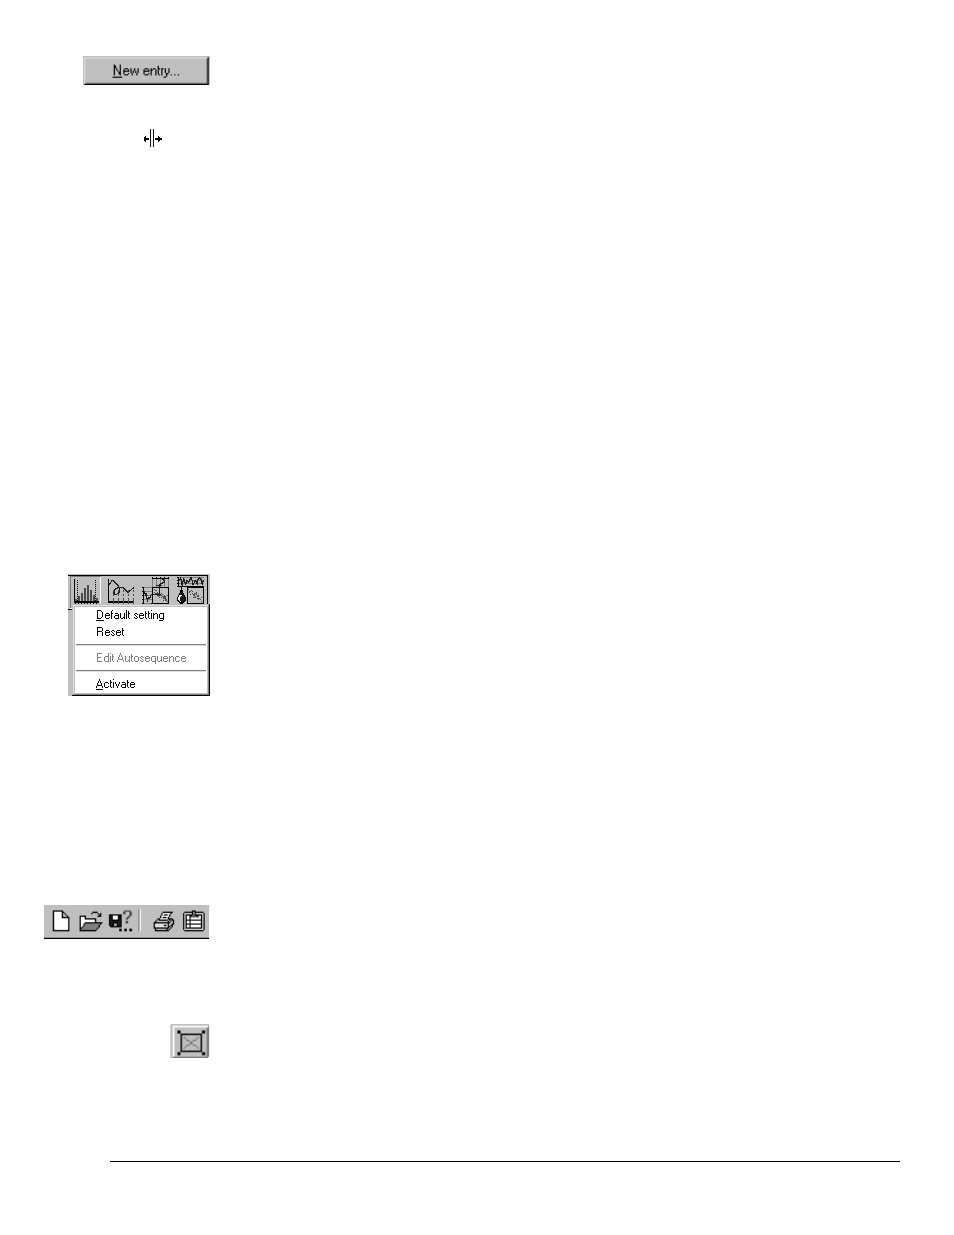
Default setting on the function
bar (use right-mouse button)
To reach the default settings for a function, click on the Function bar with the right mouse button
(for example on an analysis symbol in the optional DIAdem
®
CALC device). A context menu appears
which includes the Default setting. Activate this menu item with the left mouse key, and the
appropriate configuration dialog box will appear.
After you exit with Save changes, the changes you have made to the settings will become permanent.
In the optional DIAdem
®
GRAPH device you can change default settings for axis systems, tables, and
background graphics; in the optional DIAdem
®
CALC device all mathematical functions are affected.
In optional DIAdem
®
-CALC, the standard settings of the functions can be reproduced with “Reset.”
The related action can be executed with “Activate.” The function bar for the Autosequences can be
assigned an Autosequence using “Default” and it can be removed with “Delete default.” The
Autosequence currently assigned to the icon can be edited by clicking “Edit.”
Note:
The altered default settings are automatically written into the Desktop file in DIAdem
®
and thus saved.
When the default settings of an action have been altered, they no longer affect objects that have already
been used in a diagram or block diagram!
Commands
Part of the DIAdem
®
GRAPH Tool bar
The Tool bar which extends horizontally above the DIAdem
®
Working area contains the commands you
will need most commonly for working with any of the DIAdem
®
devices. Some of these are basic
commands such as Delete, Open and Save as; others are device-specific commands. The most important
commands in the optional DIAdem
®
GRAPH device are: Print, Output to clipboard, various commands for
aligning objects to each other, the magnifying glass and Sketch presentation. Most important in DIAdem
®
VIEW are graph definitions and various types of cursors.
Sketch Mode in
DIAdem
®
GRAPH
Activate an object in DIAdem
®
GRAPH. As soon as you press the Sketch mode button, the object is faded
out and is represented only by a place holder.
Symbolically representing objects as rectangles makes it possible for you to work with them quickly and
easily even in diagrams containing numerous objects.