How to copy or delete a graph – Measurement Computing DIAdem User Manual
Page 34
32 DIAdem® VIEW: Viewing, Measuring & Editing Data
04-19-00
DIAdem®
In a case of several graphs with
different value ranges, a scaling
that is more favorable for the
depiction should be chosen
Note:
The depiction can be done in separate sub-axis systems with the scaling “n Systems” [physical].
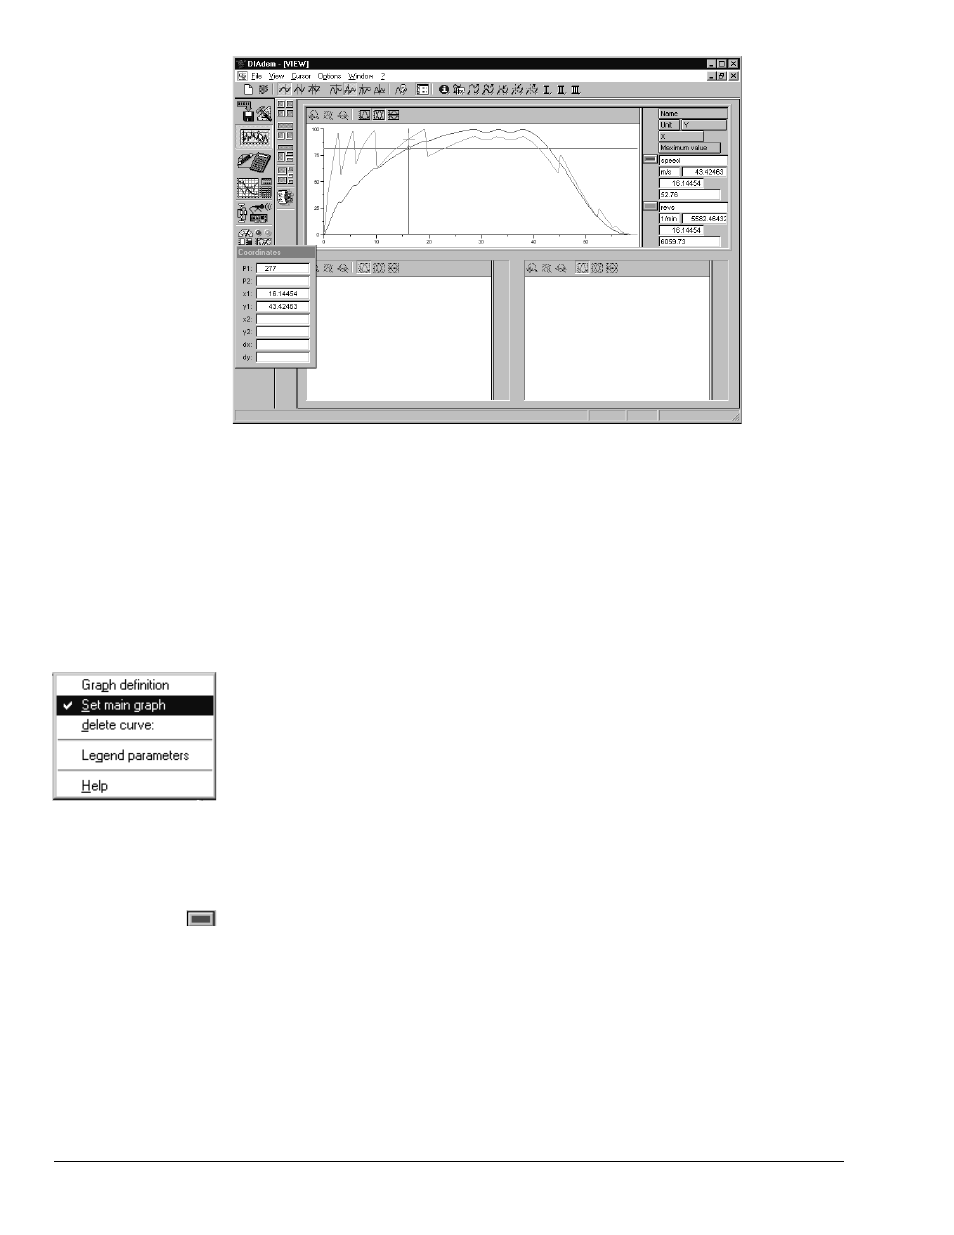
Define main graph
To carry out measurements on graphs, one of the two should be defined as the main graph. This
definition is made in the context menu of the corresponding graph symbol.
Open the context menu with a click of the right mouse button on the red graph symbol and select
“Set main graph.” When you call this context menu again, you can see that the main graph has
been set.
In the case of several graphs in
an axis system, the main graph
is defined via the context menu
of the graph icon
Now, if you move the crosshair cursor, it remains fixed on the red graph. Another crosshair is
displayed on the green graph. The point coordinates of the main graph are displayed in the
legend, as specified.
As mentioned above, if the value range is the same, the cursors in the passive axis systems follow
along. If you have selected the “Free Cursor,” the crosshairs in the passive windows orient
themselves according to the graph coordinates. If you have activated another cursor, e.g.
“Maxima-cursor,” the crosshair will be oriented in the passive windows according to the point
number; the relevant coordinates can be read in the legends.
Depending on where you click in DIAdem
®
-VIEW [with the right mouse button] the context
menu is displayed with other functions. For example, the image mode toggle may be displayed.
Note that the image mode determines whether a SHELL is displayed or suppressed.
How to Copy or Delete a Graph
Any graph that has previously been defined can be copied into another axis system using the
drag-and-drop procedure and the corresponding graph symbol.
Copying a graph
with the graph
symbol activated.
Drag the red graph symbol by pressing on the left mouse button. With the left button still held
down, move the graph symbol into the lower left axis system and release the left mouse button.
A copy of the graph and the corresponding red graph symbol now appear in the desired axis
system.
Deleting a graph
You can also delete a graph from the axis system using the graph symbol. Click on the green
graph symbol; it darkens. Then press the <DELETE>
key. Alternatively, deletion can also be
done from the context menu of the graph icon
Deleting or copying
multiple graphs
Multiple graphs can be deleted from or copied to the same axis system. Select the corresponding
graph symbols with the mouse and the <CTRL> key.