Measurement Computing DIAdem User Manual
Page 11
DIAdem
09-06-00
DIAdem
Quick Start Guide 9
4.
Click Open.
5.
Click the DIAdem-VIEW: Data Viewing button.
6.
Right-click in the empty graph region of a chart. A specific location
is not required.
7.
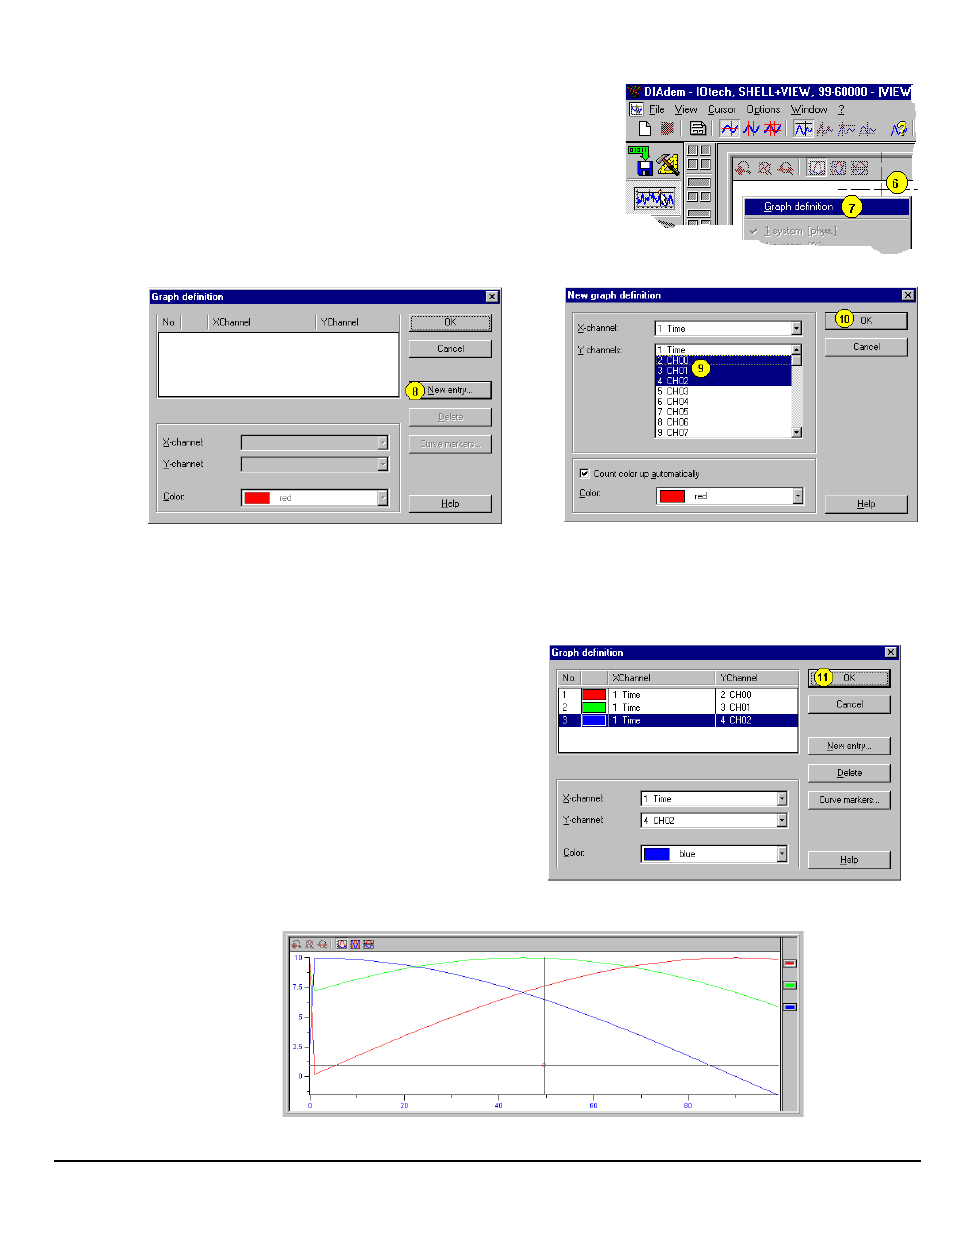
Click on the Graph Definition item listed at top of the pop-up box.
A Graph Definition box appears, as shown in the following figure.
8.
Click New Entry. A New Graph Definition box appears.
Selecting “New Entry”
Selecting Three Channels for Viewing
9.
Select three channels. Do this by holding down your keyboard’s CTRL key, then selecting three channels with the
mouse. In our example we have selected Channels 0, 1, and 2 (CH00, CH01, CH02).
10.
Click OK. A Graph Definition box appears with information regarding the three graphs. For each graph (1, 2, and 3)
the X-axis and Y-axis are identified and a graph color is indicated as shown in the following figure.
In the Graph Definitions example to the right, we see
that the X-axis represents time and the Y-axis
represents channel values.
11.
Click OK.
The three graphs can now be viewed as indicated in
the following two figures.
Graph Definition for 3 Channels
Viewing Three Graphs of Channel Values over Time