Measurement Computing DIAdem User Manual
Page 33
DIAdem®
04-19-00
DIAdem® VIEW: Viewing, Measuring & Editing Data 31
Global Coordinate Display:
Displaying Cursor Coordinates in Overview Format
The current coordinates of the graphics cursor, represented in the unit of measure of the active axis
system, are shown in the status line. You can also choose to have an overview of the coordinate
display.
Coordinate display
First activate the frame cursor. Then turn on the coordinate display in the Tool bar.
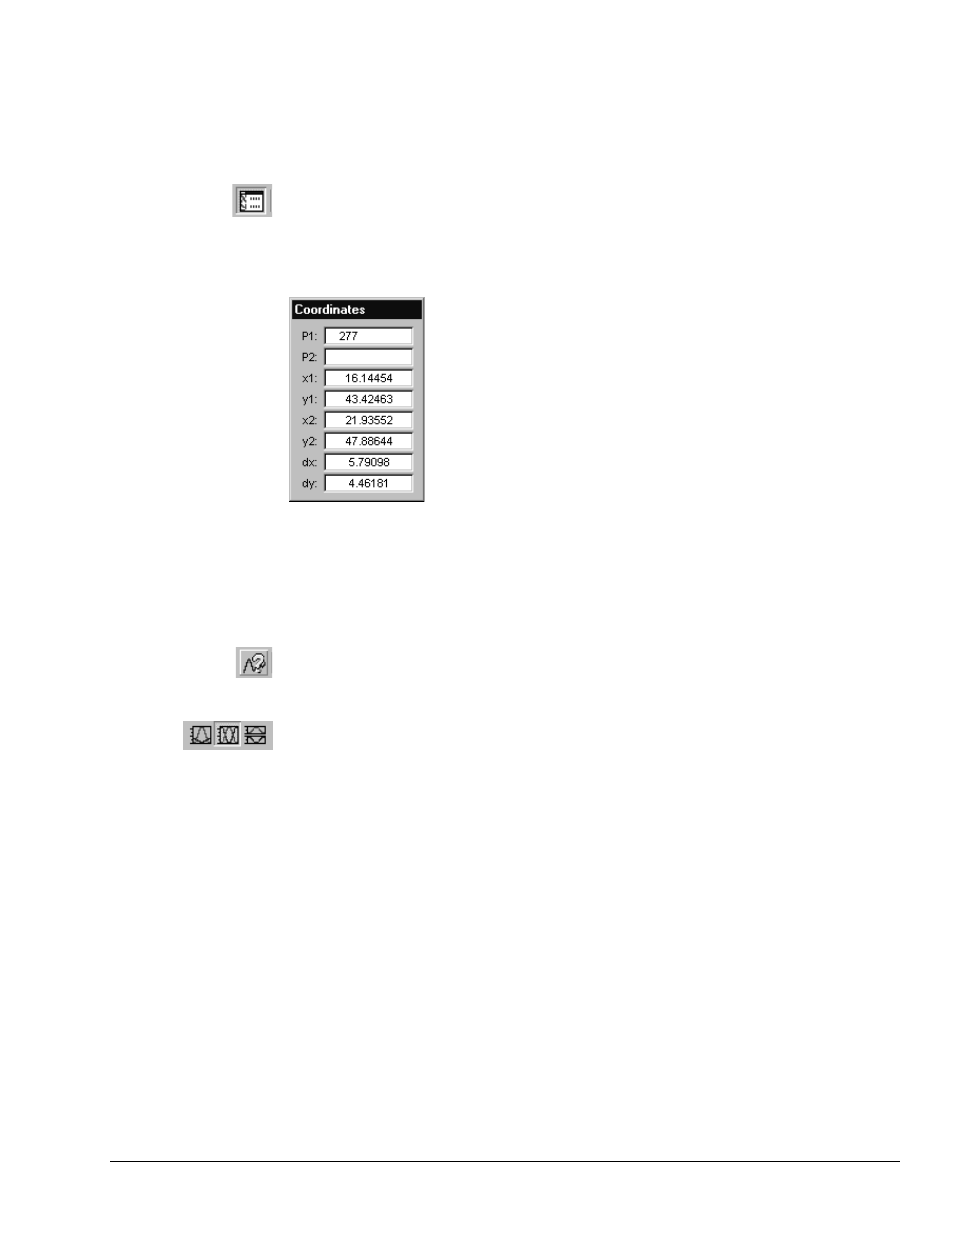
A window appears with the current cursor coordinates of the active axis system. This window
may be positioned anywhere on the screen. For the frame cursor, the X and Y coordinates and the
distances for horizontal and vertical cursor lines (dx, dy) are displayed.
Coordinate
display with frame
cursor coordinates
Axis-local Scaling:
Various Graphs in one Axis System for Clarity
If graphs whose value ranges are different are to be compared with one another in an axis system,
the depiction can be improved by choosing a different scaling mode. The scaling mode is set
separately for every axis system.
Graph definition
Define one more graph in the upper axis system. Call the graph definition and set a new graph
with the X-channel “Time,” the Y-channel “Rotational Speed” and the color “Green.” Click
“OK” twice and return to the working area.
Axis-local scaling,
here: 1 System [%]
Since the absolute values of the rotational speeds are 100 times higher than the absolute speeds,
the speed curve is merely displayed as a colored line on the abscissa. In this case, it is advisable,
to switch the scaling mode for that axis system to “1 System [%].” The labeling of the ordinate
will now be done referred to the entire Y-value range as a percentage.