Meters, Meters…… 32, Bar graph meters …… 32 – Measurement Computing WaveView User Manual
Page 34
WaveView, pg. 32
03-05-02
WaveView
Meters
Bar Graph Meters
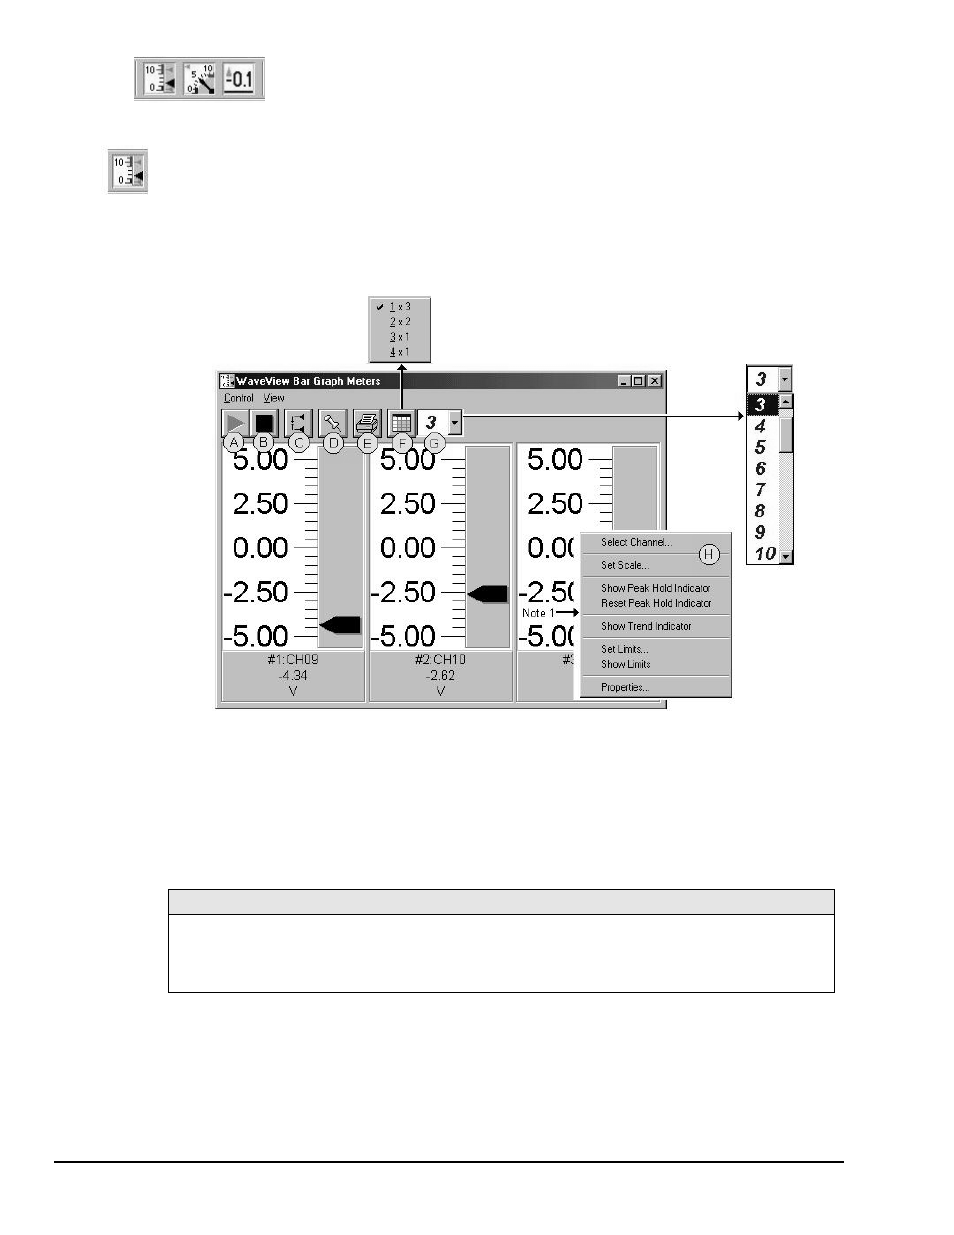
You can use the Bar Graph Meters button or select Bar Graph Meters from WaveView’s View pull-down
menu to access the Bar Graph window. This window displays several channels in bar graph format. To
activate the display, select the Start button (A) from the toolbar. You can select to view up to 32 meters at a
given time.
Note: To view an active meter, at least one active (On) channel must be assigned to the meter, and the
Reading’s column (on WaveView’s main window) must be enabled.
Bargraph Meters, Shown with 3 Meters Selected for Viewing
The items in this window are as follows:
A - Start
C - Reset Peak Hold
E - Print
G - Number of Meters
B - Stop
D - Stay On Top
F - Rows x Columns
H - Configuration Pop-Up Menu
These items are discussed in more detail, following the description of Digital Meters.
Configuration Note: …. for Bar Graph Meters
For Bar Graph Meters, configure the meter settings by first clicking the right mouse button anywhere
within the meter display area. A pop-up menu will appear, allowing you to reconfigure the meter in
regard to scale, limits, channel selection, adding peak hold indicators, etc. Refer to the upcoming
section entitled
for more detail.
Note 1: Double-clicking the left mouse button in a meters scale area brings up a channel selection pop-up
menu. A single click with the right mouse button in this same area brings up a configuration pop-
up menu (item H). Both of these pop-up menus are discussed in the upcoming section, Meters
Configuration Menu.