Measurement Computing WaveView User Manual
Page 31
WaveView
03-05-02
WaveView, pg. 29
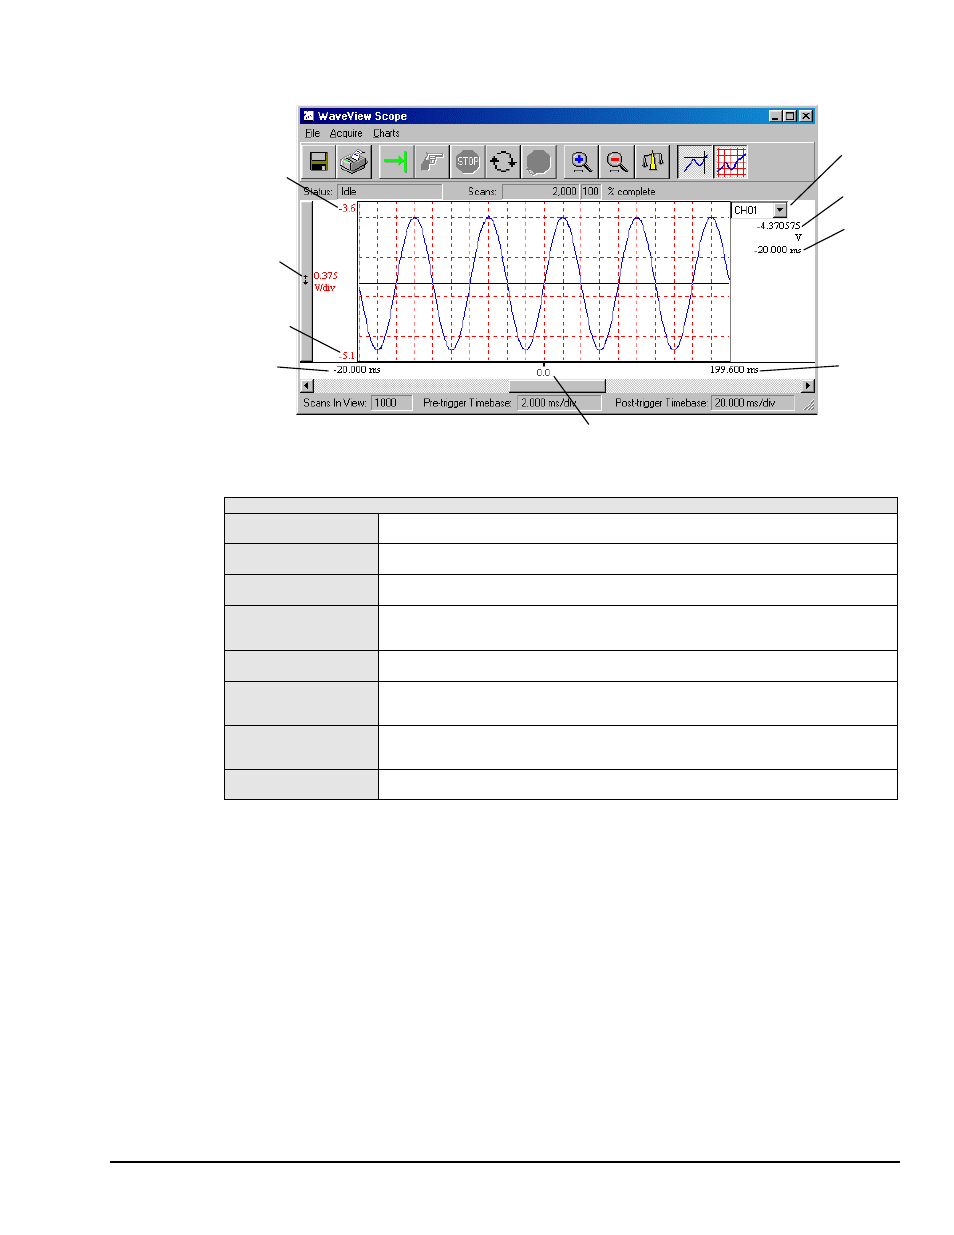
Scope Display
The following figure identifies features of the WaveView Scope display.
Note 1: For Scope applications [pertaining to WBK17], the channels will be identified by the same names
used in the Label column on the WaveView Configuration spreadsheet.
Scope Mode Indicators & Descriptions
Y-axis Adjust
Allows adjustment of the displayed range. Clicking on the value highlights the number.
Enter desired new value and press Enter.
Individual Channel
Scaling
Adjusts the scaling of the individual channels so that the visible waveform fills 90% of the
graphs range.
Time of First Scan in
View
Displays the acquisition time of the first scan currently displayed on the chart.
Trigger Point
Displays the trigger event.
Note: Depending on the current acquisition parameters and chart display configuration,
the trigger point may or may not appear on the chart.
Time of Last Scan in
View
Displays the acquisition time of the last scan currently displayed on the chart.
Channel Select
Clicking on this control displays the list of all channels selected in the WaveView
configuration menu. A maximum of 8 channels may be displayed at one time with the
remaining channels available through the scroll bar.
Magnitude
Displays the magnitude of the signal at the point where the marker cross-hair intersects
the waveform. Moving the marker to different locations on the waveform changes the
value of the displayed voltage.
Time
Displays the point on the acquisition time-line where the marker cross-hair intersects the
waveform. This value changes as the marker is moved along the X-axis (time scale).
In addition to the above features of the Scope window, there are status bars above and below the charts that
display information about the timebase of the current display and the status of the current acquisition:
Status – Indicates the current acquisition state of the WaveBook. If there is no acquisition in progress, the
status is Idle. During an acquisition, the status steps through all or part of the following sequence:
Configuring, Waiting For Trigger, Triggered, Transferring, Graphing, and then back to Idle.
Scans – During an acquisition, this field displays the current transfer count. Afterwards, it is the total scans
in the previous acquisition. A percent complete value is shown to the right of the scan count. After an
acquisition, this normally reads 100%.
Activity Indicator – During an acquisition, a small window appears next to the status field that shows an
animated sine wave. This indicator is active whenever the acquisition status is not “Idle.”
Scans in View – The number of scans displayed across the X-axis.
Pre-trigger Timebase – The pre-trigger timebase in time units per division. This field is blank when no
pre-trigger data is currently on the chart.
Post-trigger Timebase – The post-trigger timebase in time units per division. This field is blank when no
post-trigger data is currently on the chart.
Channel
Select
(Note 1)
Magnitude
Time
Time of
Last Scan
in View
Time of
First Scan
in View
Individual
Channel
Scaling
Y-axis Adjust,
Upper Limit
Y-axis Adjust,
Lower Limit
Trigger Point