File, Acquire, Charts – Measurement Computing WaveView User Manual
Page 30
WaveView, pg. 28
03-05-02
WaveView
Menu Items & Toolbar Buttons
You can control the acquisition process and the Scope display from the menu selections and toolbar
buttons. There are more pull-down menu selections available than there are buttons; however, each button
does have a corresponding menu item.
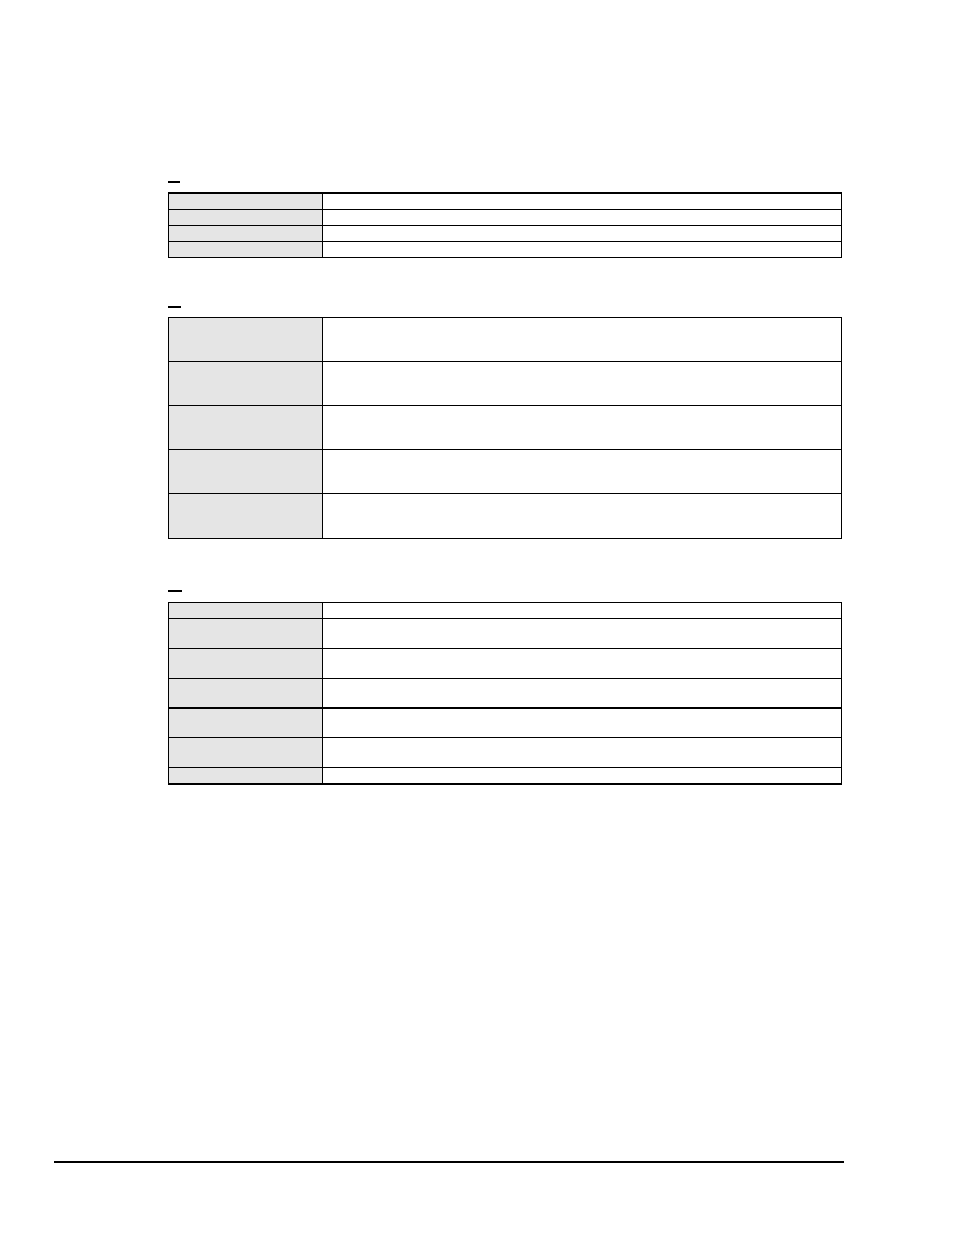
File
Save Data Files
Saves data in the file name and data formats that have been previously assigned.
Save Data File As
Prompts you for a name for the data file before saving the data.
Print Window
Prints the contents of the display screen.
Close Scope
Closes the Scope display and returns to the configuration menu.
Acquire
Arm
Arms the WaveBook to acquire data. Data acquisition will commence as soon as the
triggering conditions are satisfied.
Trigger
Issues a Software Trigger to the WaveBook. Whenever the WaveBook is armed and
waiting for a trigger, you can take this action to force data acquisition to start.
Stop Acquiring
Ends the current acquisition immediately. All data collected prior to this action will be
retained in memory and displayed in the chart control. If auto-rearm is enabled, this
action stops the rearming as well.
Auto-Rearm
When enabled, the WaveBook is automatically re-armed whenever an acquisition ends.
With this feature, you can use WaveView like an oscilloscope to display a rapid series of
your channel inputs.
Stop Rearming
With auto-rearm enabled, this action stops auto-rearming but allows the current
acquisition to complete. (Pressing “Stop Acquiring” ends the current acquisition
immediately.)
Charts
Number of Charts
Sets the number of charts (maximum of 8) to be displayed simultaneously.
Zoom In
Halves the visible timebase. Example: if 10 ms of information is visible, clicking Zoom In
will show 5 ms. Maximum Zoom In is 2 samples.
Zoom Out
Doubles the visible timebase. Example: if 10 seconds of information is visible, clicking
Zoom Out will show 20 seconds. Maximum Zoom Out is 2000 samples.
Enable AutoScaling
Continuously adjusts the Y-axis for all channels so that the visible waveform fills 90% of
the graph’s range.
Scale All Charts
Adjusts the Y axis for all channels so that the visible waveform fills 90% of the graph’s
range.
Display Cross Hairs
A cross hair is a marker that shows the numerical values of time and amplitude at its
present location in the waveform. Toggle button to turn cross hairs on or off.
Display Grids
Displays a grid for each chart. Toggle button to turn grids on or off.
Individual cross-hairs can be moved by holding down the left mouse button and dragging the selected cross-
hair to the new location on the chart. Holding the right mouse button and dragging, moves all the cross-hairs
simultaneously to a new location. The voltage and time display at the side changes as you do this.
Cross-hairs are disabled during an acquisition.