Step 3 - start daqview & configure the system – Measurement Computing Personal Daq/3000 Series User Manual
Page 8
324400D-01
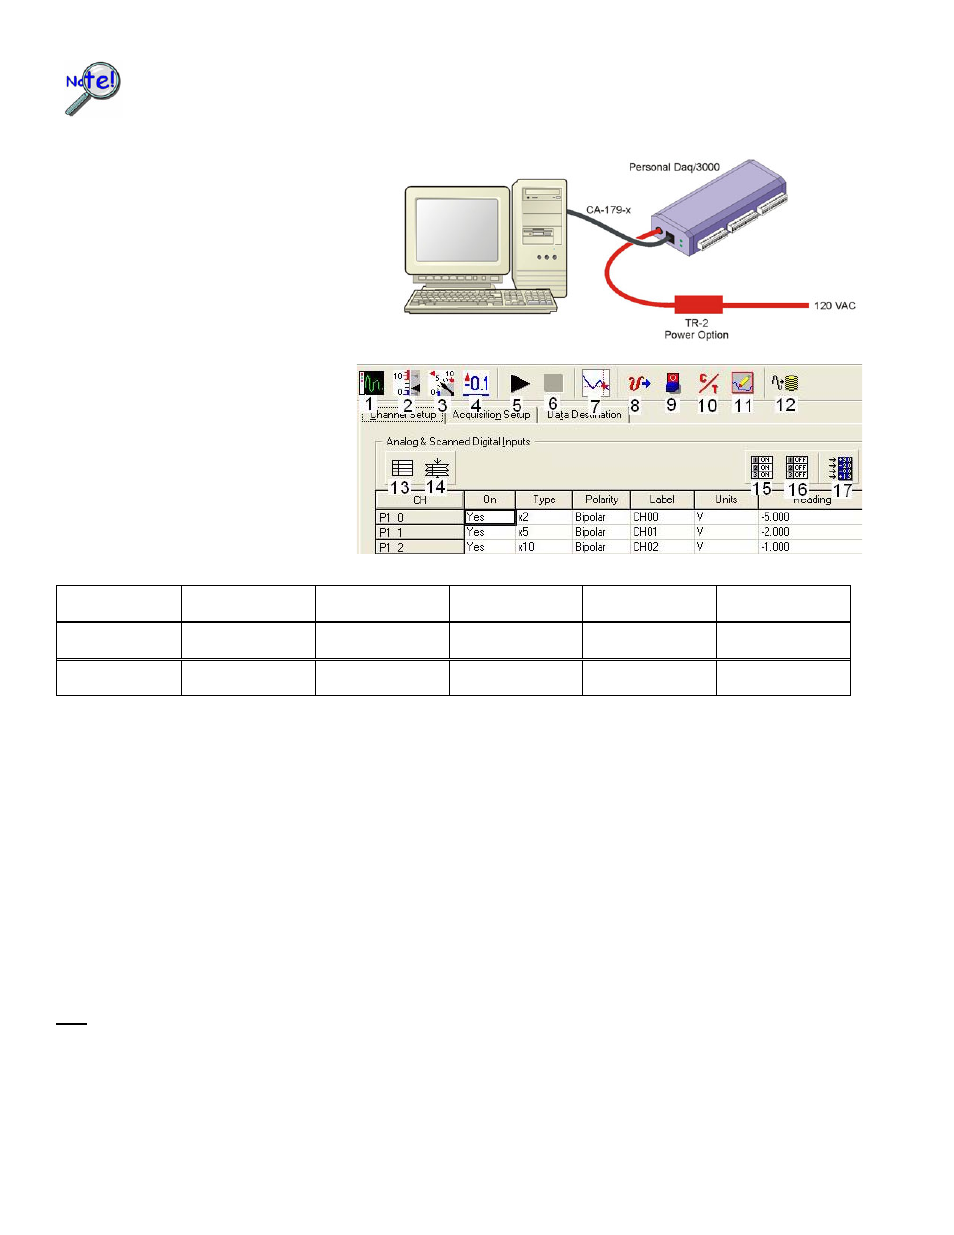
If using a TR-2, be sure to supply power from it to the Personal Daq/3000 before connecting the USB cable to the
computer
. This allows the device to inform the host computer [upon connection of the USB cable] that the unit
requires minimal power from the computer’s USB port.
Use a CA-179-x USB cable to connect the
Personal Daq/3000 Series device to a USB
port on the computer. Note that use of a
PC with a USB2.0 port is recommended. A
USB1.1 port will work, but will result in
lower performance.
Step 3 - Start DaqView &
Configure the System
From Windows, open DaqView by double
clicking on its icon, or use the Windows
Desktop Start menu to access the program.
You will find DaqView listed in the Program
group (Use the desktop Start Menu /
Programs to access the group).
Once the program is executed, software
automatically identifies your Personal
Daq/3000 Series device and brings up
DaqView’s Main Window.
Button Reference
(1) Scope
(2) Bar Graph
Meters
(3) Analog Meters
(4) Digital Meters
(5) Start All
Indicators
(6) Stop All
Indicators
(7) View File Data
(8) Analog Output
(9) Digital I/O
(10) Counter/Timer
(11) Waveform &
Pattern Output
(12) Acquire
(13) Show ALL
Channels
(14) Hide INACTIVE
Channels
(15) Turn All Visible
Channels ON
(16) Turn All
Channels OFF
(17) Channel
Reading
To configure channels, make the desired changes in the Channel Setup window. This window displays the analog and
scanned digital input channels and allows you to configure; for example: you can change a channel from bipolar to unipolar
and can change its units.
To configure acquisition parameters, select the second tab (below numbers 4 & 5 in the above figure). This displays
the Acquisition Setup window, which you can use to set triggering and configure the scan. The settings will be used when an
acquisition is started.
To assign a filename and folder, select the third tab (below numbers 6 & 7 in the above figure). This displays the Data
Destination window, which provides a means of designating the desired file names, file formats, and the directory for saving
the acquired data.
To collect data, Click the
acquisition begins and the readings column becomes active. Click the
Click one of the toolbar’s display icon buttons to see your data in the form of a scope or meter display. Click the
button (1) to bring up the Scope window. This allows you to set up scope and chart displays. Buttons 2, 3, and 4 are for bar
graph meters, analog meters, and digital meters. Note that you can simultaneously view combinations of display types.
Note: For detailed information, view the PDF documentation located on CD, at our website, or in the Programs Group [which
resides on your PC, after software installation].
*324400D-01*