Highlight color, Input mapping, Row count – Daktronics Data Manager (DDM) User Manual
Page 21: Input & output monitors
Operation
15
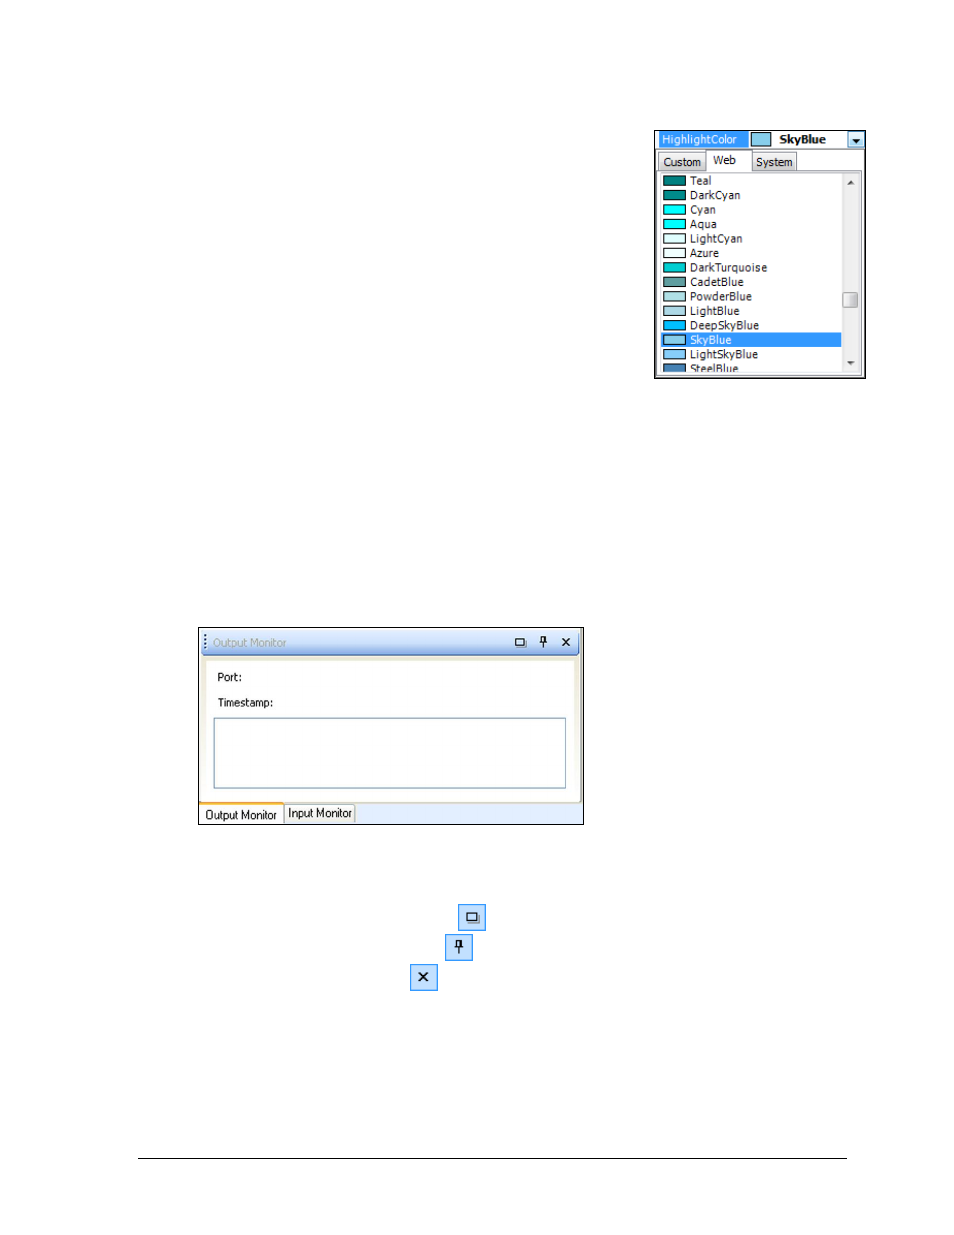
Highlight Color
This configuration box is used to change the color of column
headers. Click HighlightColor, and then click the arrow to select
from a wide variety of preset colors (Figure 16).
Note: Changing the highlight color, text colors, and text
sizes or fonts will not affect their appearance on the display.
Input Mapping
This configuration box is used to define what input package
fields are to be displayed in which cells of the spreadsheet. See
Advanced Data Importing for more information about package
suites and input mapping.
Row Count
This configuration box is used to define the total number of rows in a column, not counting
the header. If the final number of rows in a column is unknown, leave the Row Count value
set to “-1” and the first empty row will be used to determine the actual row count.
Input & Output Monitors
The bottom of the Document Actions task pane displays both an Input Monitor and an Output
Monitor (Figure 17). These toolbars are used to detect problems in receiving or sending data.
Each toolbar shows the port that data is traveling through, the last time the data was sent or
received, and the data itself.
The toolbars can be rearranged or removed entirely:
Click the Toggle Tabs button
to view both monitors side by side.
Click the Auto Hide button
to minimize one or both monitors.
Click the Close button
to remove one or both monitors from the Document
Actions task pane. Use the View button to bring them back.
Click and drag the monitor toolbars to move them anywhere on the screen.
Note: For newer versions of Excel, the data monitor window may have a black background
with black text, so it appears as if nothing is outputting. To confirm that data is in fact being
sent out, click and drag on the text in this box.
Figure 16: Highlight Color
Figure 17: Input & Output Monitors