Blue alert® mobile, Blue alert mobile powered by guardly, User guide – Code Blue BLUE ALERT MOBILE User Manual
Page 15
Code Blue
•
259 Hedcor Street
•
Holland, MI 49423 USA
•
800.205.7186
•
www.codeblue.com
GU-151-A
page 15 of 30
Blue Alert® Mobile
User Guide
Each Geofence will be listed on the right side of the chart with a color designating its representation.
To see the percentage of incidents for a specific Geofence, move your mouse cursor over the re-
spective Geofence color on the chart. A text box will appear showing the name of the Geofence you
have highlighted, the number of incidents and the percentage of incidents occurring in that Geo-
fence out of the total number of incidents during the time frame.
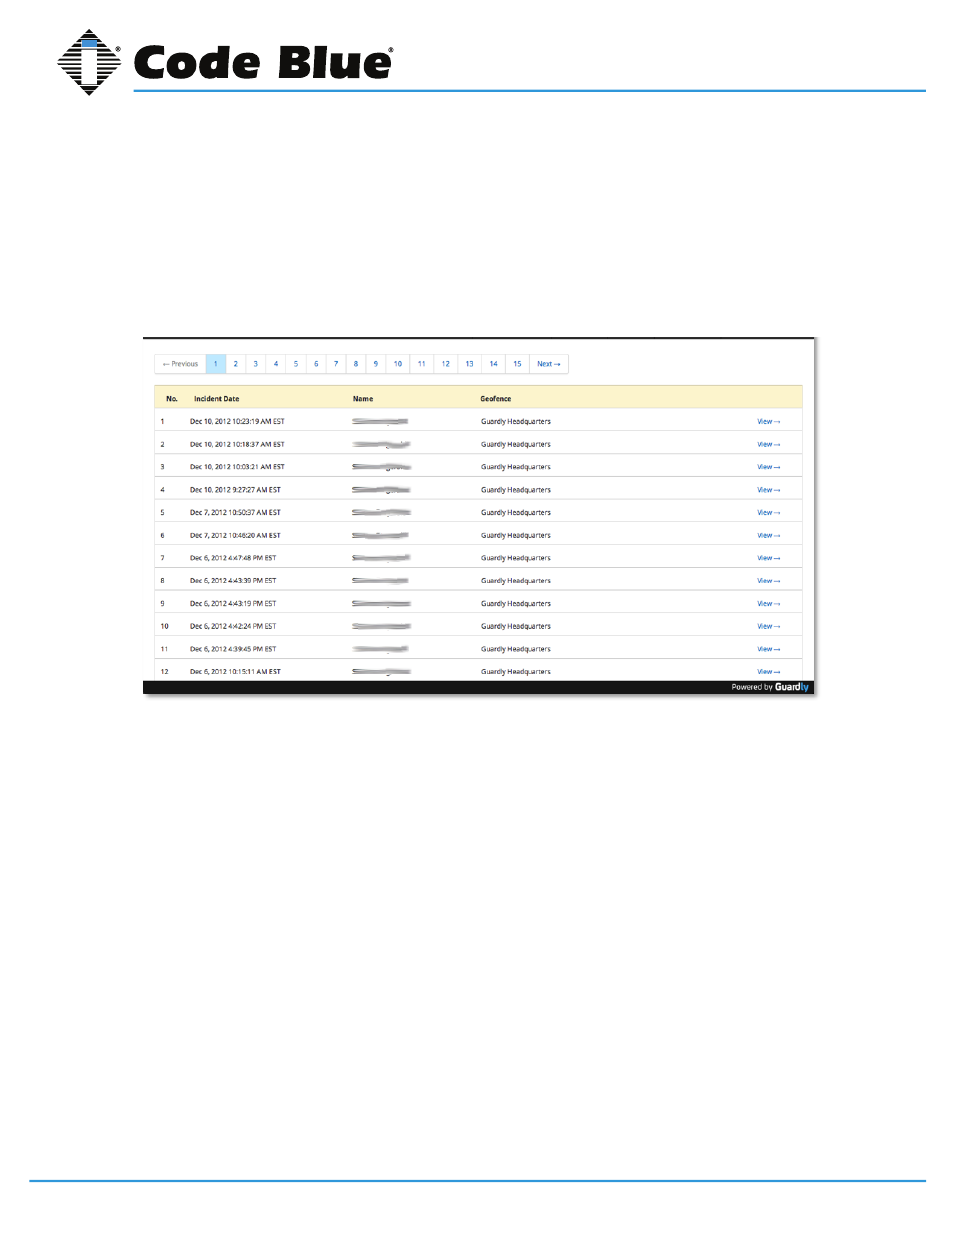
Incident Details
Under the Incident Map View and Incident Graph View there is a list of all individual incidents that
occurred during the predefined time frame you have searched.
The incidents are listed from the most recent to the most dated.
To find older incidents, click Next, Previous or the page number.
Each incident will have:
• The number of incidents in the predefined time frame in order of the most recent to most dated.
• The incident date.
• The name of the person triggering the incident.
• The Geofence in which the incident occurred.
To get details of an individual incident, click the View Link to the right of the individual incident.
Blue Alert Mobile Powered by Guardly
16
IN-170-A
On the y-axis of the graph you will have the number of incidents per date. On the x-axis of the graph you
will have the date.
To see the number of incidents that occurred on a specific day, simply move your mouse cursor over a
specific point on the line graph. A text box showing the specific date and the number of the incidents for
that specific date will appear.
Incidents by Geofence
The Incidents by Geofence graph is a pie chart that shows the percentage of incidents that occurred in
each specific Geofence during the predefined timeframe.
Each Geofence will be listed on the right hand side of the chart with a color designating its
representation on the chart.
To see the percentage of incidents for a specific Geofence, move your mouse cursor over the respective
Geofence color on the chart. A text box will appear showing the name of the Geofence you have
highlighted, the number of incidents in that specific Geofence, and the percentage on incidents
occurring in that Geofence out of the total number of incidents during the Timeframe.
Incident Details
Under the Incident Map View and Incident Graph View there is a list of all individual incidents that
occurred during the predefined Timeframe you have searched.