Blue alert® mobile, Blue alert mobile powered by guardly, User guide – Code Blue BLUE ALERT MOBILE User Manual
Page 14

Code Blue
•
259 Hedcor Street
•
Holland, MI 49423 USA
•
800.205.7186
•
www.codeblue.com
GU-151-A
page 14 of 30
Blue Alert® Mobile
User Guide
Incident Density Map
In the Map View tab, you will see the Incident Density Map.
This map gives information on the regions that experience the highest number of incidents.
Incident density is shown with red circles. The larger the red circle, the higher the number of inci-
dents that were reported in those regions.
Areas without any red circles have not experienced an incident.
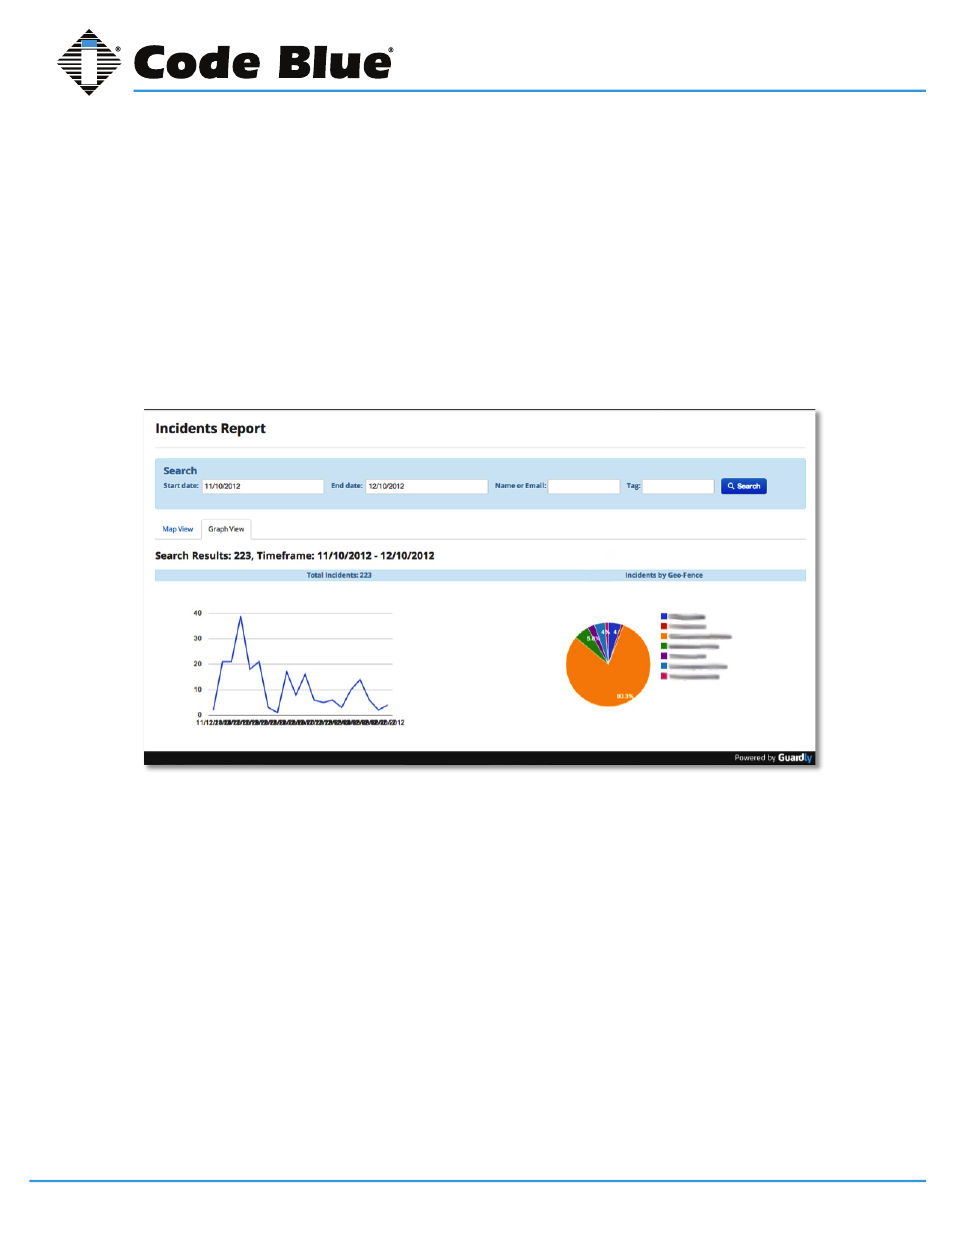
Incident Graph View
You will be able to access a line graph showing the total number of incidents by date, as well as a
pie chart detailing the percentage of incidents by Geofence in the Incident Graph View tab.
Total Incidents Graph
The Total Incidents graph will calculate the total number of incidents in the predefined time frame.
On the Y-axis of the graph, you will have the number of incidents per date. On the X-axis, you will
have the date.
To see the number of incidents that occurred on a specific day, move your mouse over a specific
point. A text box showing the specific date and number of the incidents will appear.
Incidents by Geofence
The Incidents by Geofence graph is a pie chart that shows the percentage of incidents that occurred
during the predefined timeframe.
Blue Alert Mobile Powered by Guardly
15
IN-170-A
The number of incidents within the predefined Timeframe will appear just below the Map View and
Graph View Tab.
Incident Density Map
In the Map View tab you will see the Incident Density Map.
This map gives information of the regions that experience the highest number of incidents.
Incident Density is shown with red circles. The larger the red circle, the higher the number of incidents
that were reported in those regions.
Areas without any red circles have not experienced an incident.
Incident Graph View
In the Incident Graph View tab you will be able to access a line graph showing the total number of
incidents by date as well as a pie chart detailing the percentage of incidents by Geofence.
Total Incidents Graph
The Total Incidents graph will calculate the total number of incidents in the predefined Timeframe.
