1 point source spl mapping – d&b TI 385 d&b Line array design User Manual
Page 31
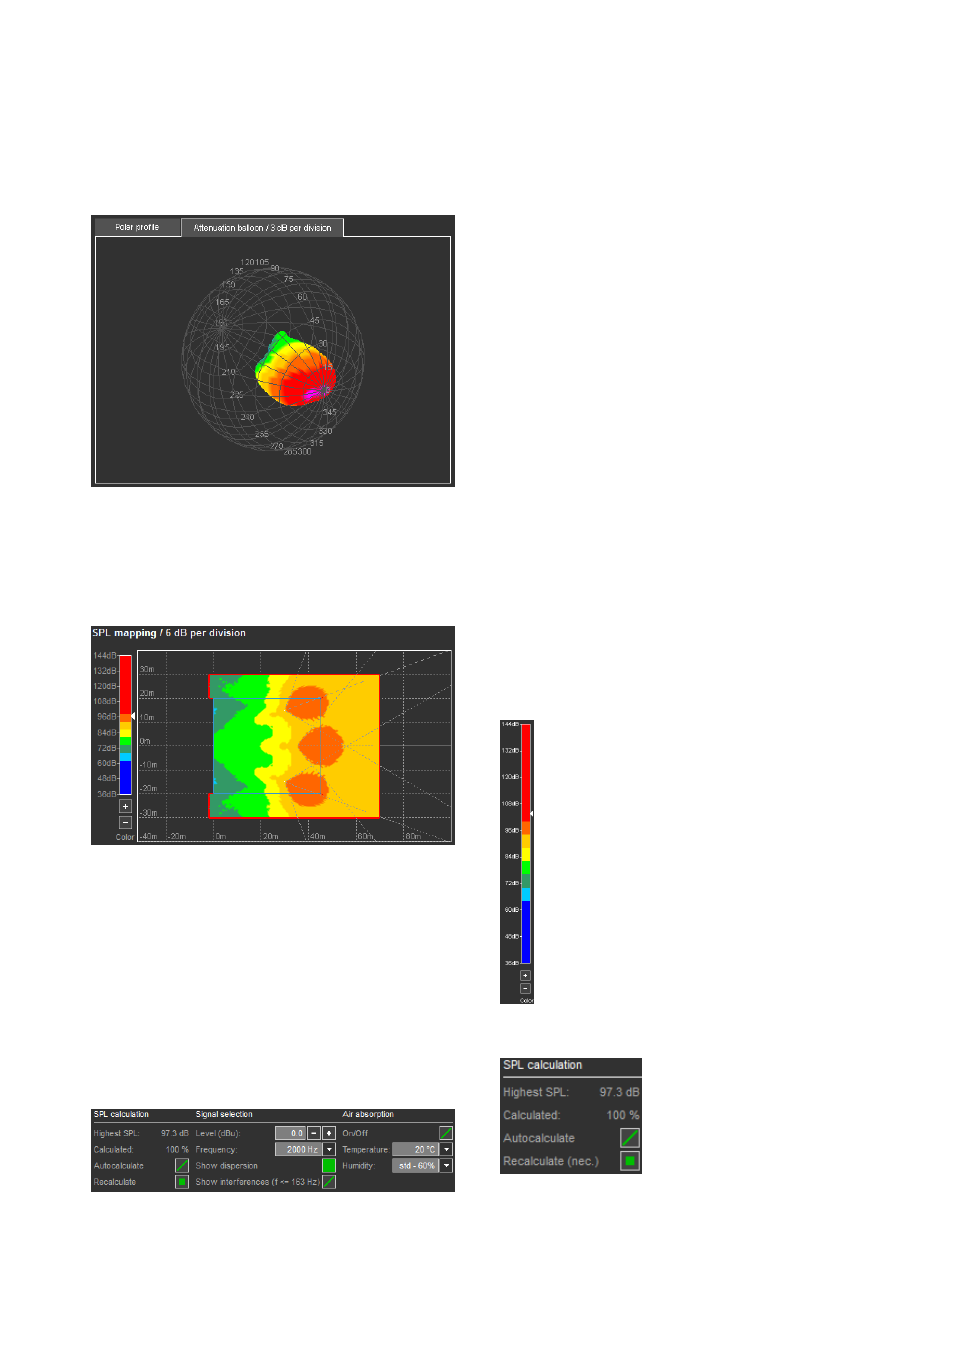
Attenuation balloon
The diagram displays the 3D polar plot of the selected
loudspeaker in the form of an attenuation balloon or
alternatively the projection of the listening planes in the
horizontal direction of the main axis, the main axis itself and
the nominal –6 dB axes.
— Dragging with the mouse alters the viewing angle.
— Turning the mouse wheel zooms in and out.
— Double-clicking into the diagram always takes you back
to the default side view.
10.9.1 Point source SPL mapping
Point source SPL mapping
The mapping plot shows
the calculated level distribution on
all active listening planes including the level contribution of
all sources of the currently active point source group, the
positions of the cabinets, their aiming and their nominal
– 6 dB coverage.
Spatial resolution of the SPL mapping
The spatial resolution of the mapping calculation is fixed to
1m with a minimum of 400 points per plane.
Signal selection and SPL summation method
You can select the simulated frequency range in standard
third octave bands.
For frequency bands of 163 Hz and below you can use
complex SPL summation as an option thus showing
interferences. Higher frequencies are always displayed as
an energy sum. To display interferences correctly and
totally, the spatial resolution of the mapping has to be in the
range of half the wavelength of the simulated frequency.
The 163 Hz band is able to fulfill this requirement for a
minimum resolution of 1 m. A mapping with a higher
resolution would dramatically increase calculation time
while providing minimum additional information.
Here you can also set the signal level that is applied to all
amplifier inputs. The selected frequency band is monitored
for sufficient headroom (Refer to section 10.7.9 Maximum
SPL and headroom on page 27).
Air absorption
When the Air Absorption switch is activated, ArrayCalc
calculates this effect for selectable temperature and
humidity values. The Air Absorption switch and the
environmental settings are located in the Extras-Options
menu and are also directly available from the toolbar. T
o
define the temperature units, click Extras-Options and
choose between degrees Celsius and Fahrenheit under
Units. The relative humidity can be specified in 4 steps:
"dry-20 %" , "low-40 %", "std-60 %" and "high-80 %".
The global Air absorption switch and the environmental
settings affect all SPL calculations both on the Sources page
as well as on the 3D plot page (refer to section 10.7.10 Air
absorption on page 27).
Color scale
The color scale for the SPL mapping has a fixed
6 dB per division resolution. The color scale
window displayed can be set according to the
calculation results. This is done by either clicking the
+/-- buttons underneath the scale or using the
mouse wheel while the mouse pointer is on the
scale. The small arrow to the right of the scale
indicates the highest SPL value calculated for the
plot.
The color scale does not rescale automatically. This
enables you to quickly notice the result of any
change in the setup while optimizing the project.
For a start, we recommend you to set the scale
taking the displayed "highest SPL" value as a
reference.
Automatic calculation and status
When the Autocalculate switch is
activated, the 3D mapping
calculation immediately starts as
soon as any relevant parameter
in the project is changed.
The calculation starts using a very
rough resolution, getting more and more detailed until the
maximum resolution is reached. In this process the mapping
plot is constantly updated.
TI 385 (6.0 EN) d&b Line array design, ArrayCalc V8.x
Page 31 of 54