Events tab – EXFO FTB-7000 OTDR for FTB-200 v2 User Manual
Page 222

Analyzing Traces with the Bidirectional Analysis Application
208
FTB-7000 Series
Viewing Results
Events Tab
You can view information about all detected events on a trace and fiber
sections by scrolling through the events table. In graph view, when you
select an event in the events table, marker A appears on the trace over the
selected event. When the selected event is a fiber section, this fiber section
is delimited by two markers (A and B). For more information on markers,
see Using Markers to Edit Events on page 225.
These markers pinpoint an event or a fiber section, depending on what is
selected in the events table. You can move markers directly by selecting an
element in the events table or on the graph. The application will
automatically select the event or fiber section corresponding to the point
you press on the graph.
The events table lists all the events detected on the fiber. An event can be
defined as the point at which change in the transmission properties of light
can be measured. Events can consist of losses due to transmission, splices,
connectors or breaks. If the event is not within the established thresholds,
its status will be set to “fail”.
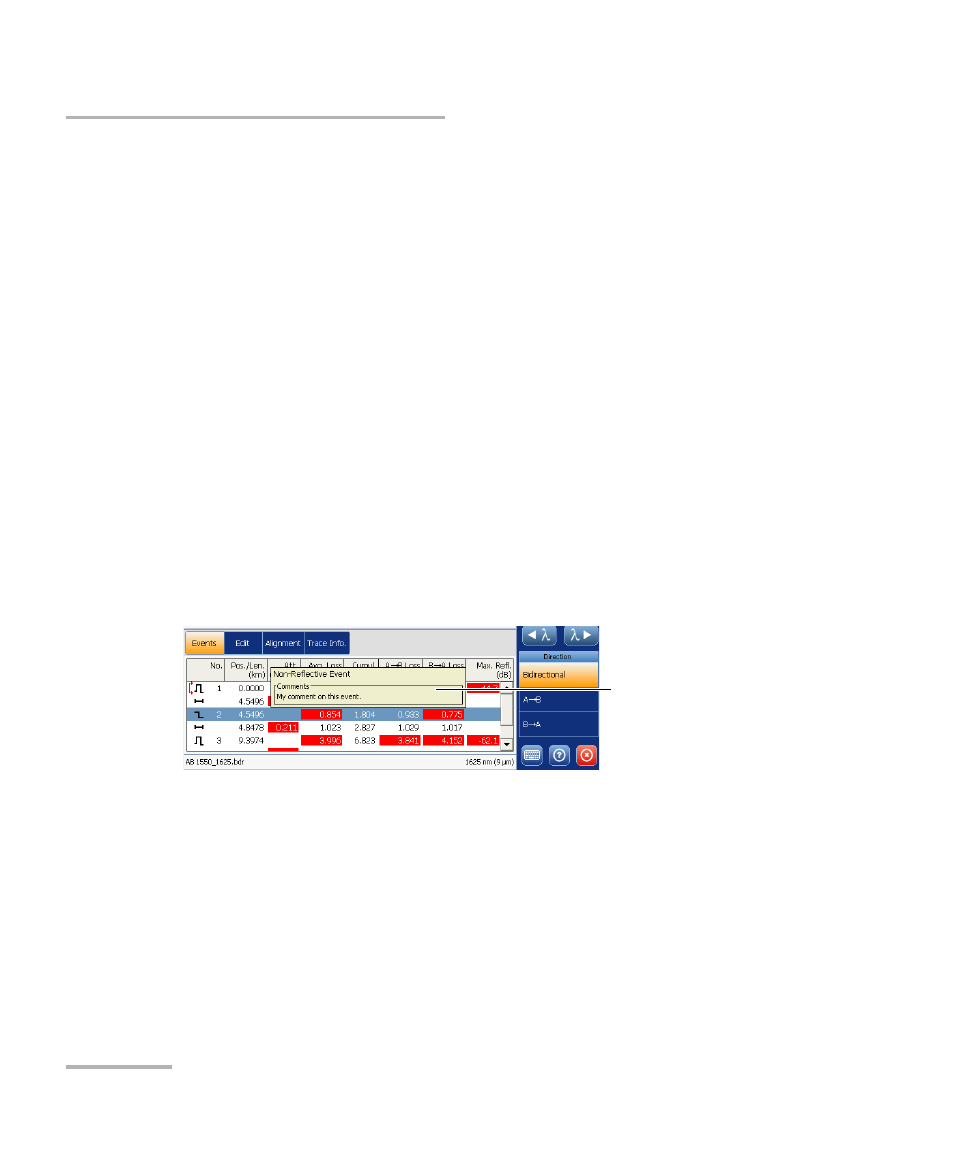
If you press and hold the row corresponding to a specific event or fiber
section for a few seconds, the application will display a tooltip identifying
the item (for example, Non-reflective event).
If an asterisk appears next to the event symbol, the tooltip will also show
“(*:Modified)” to indicate that this event has been modified manually.
If the asterisk appears next to the event symbol, “(*:Added)” will appear to
indicate that this event has been inserted manually.
Tooltip identifying the
selected item
