USL DAX-16 User Manual
Page 16
DAX-‐16 Installation & Operation Manual
Rev 1.4
16
13. If the DAX-‐16 is using a BLU link interface, set the sample rate to match the rest of the BLU link
loop.
This
determines
how
many
BLU
link
channels
are
available
in
the
system.
Note
that
the
Dolby
CP850
runs
48kHz
on
the
Atmos
Connect
loop.
14. If the DAX-‐16 is being driven with one of the USL sound processors listed in the Load Default
Channel/Band Labels and Routing section, click the appropriate button to set these values.
15. If the DAX-‐16 is not being driven by one of the listed USL sound processors, enter a channel
name,
band
name,
and
set
the
source
for
each
output.
If
a
crossover
in
the
processor
is
not
being
used,
the
Band
Name
can
be
left
blank.
Output
numbers
refer
to
the
DE-‐15
connector
on
the
back,
each
of
which
carries
two
channels.
For
example,
8A
and
8B
are
on
the
last
two
outputs
of
the
DAX-‐16.
The
channel
name
and
band
name
can
be
in
any
language
and
use
any
Unicode
character
supported
by
the
browser.
16. The default stream compressor settings (1ms attack, 256ms release) can usually be left as they
are.
If
desired,
the
attack
time
can
be
increased
to
reduce
“pumping,”
and
the
release
time
can
be
decreased
to
increase
the
average
volume.
17. If desired, sent Bypass on digital input loss to Enabled. An analog bypass signal (fed to the DAX-‐
16
on
the
rear
panel
terminal
block
or
through
Digital
Input
B
on
the
DAX-‐16C)
is
sent
to
the
left
and
right
outputs
on
loss
of
the
digital
input
signal
or
failure
of
the
DAX-‐16.
18. Adjust the output trims as required. When set to 0dB, the DAX-‐16 outputs 300mV RMS when
driven
with
a
sine
wave
that
peaks
at
-‐26dBFS.
This
level
corresponds
to
the
digital
output
level
of
USL
processors
(26dB
headroom).
See
the
Browser
Support
section
on
how
different
browsers
handle
the
slider
adjustments.
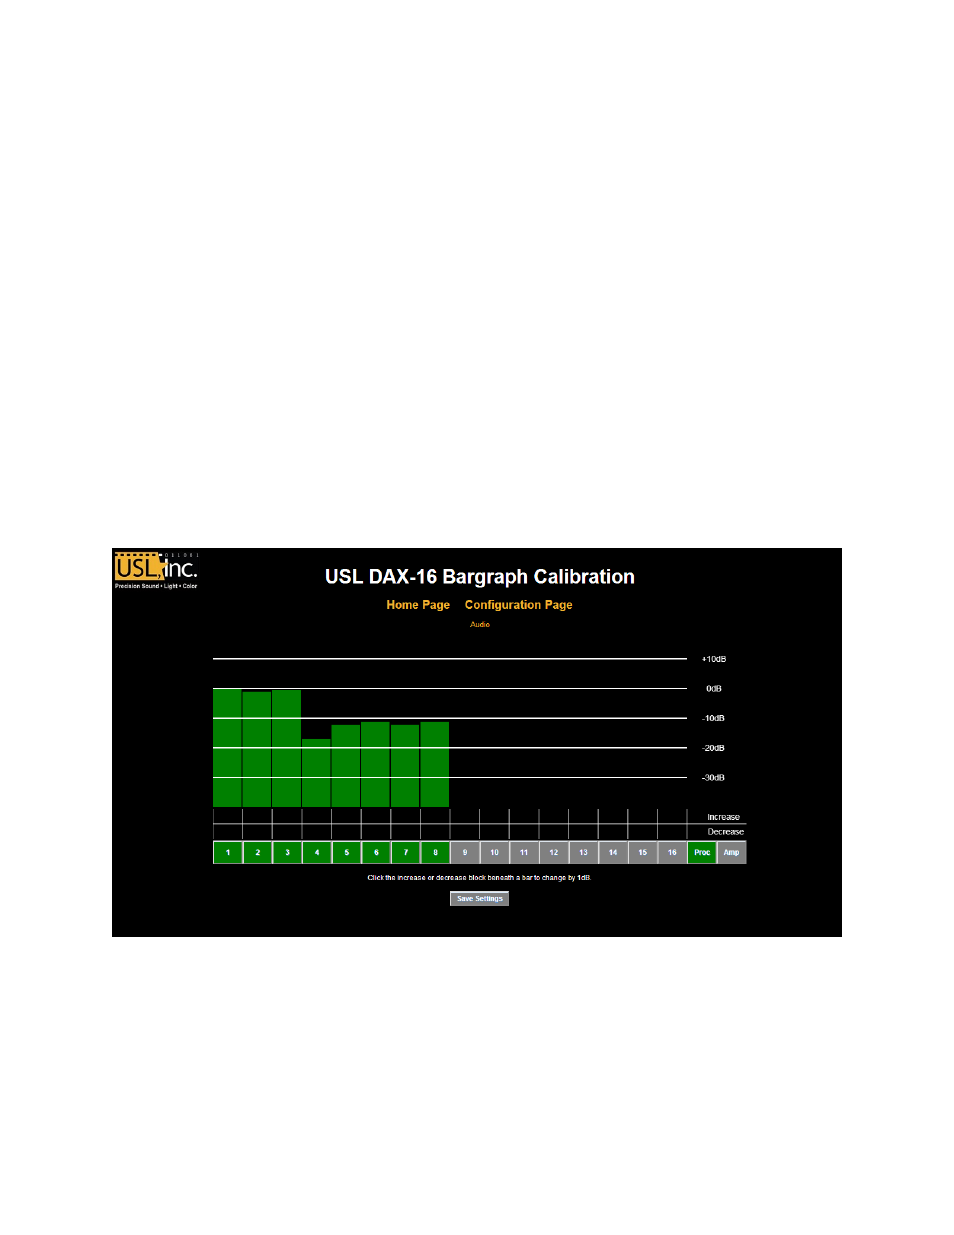
19. Click the link to the Bar graph page. This page is shown in figure 7.
Figure 7 -‐ Bar graph calibration page.
20. Apply a reference signal to each digital input. Press the Proc button to have the bar graphs
represent
the
DAX-‐16
outputs.
Between
each
bar
and
each
button
are
two
rectangular
areas.
Clicking
the
top
area
increases
the
bar
graph
display
by
1dB.
Clicking
the
lower
area
decreases
the
bar
by
1dB.
Adjust
each
bar
to
0dB
with
the
reference
signal
driving
the
digital
inputs.
21. Press the Amp button to have the bar graphs represent the amplifier output sample (Vmon). As
in the previous step, adjust each bar graph to 0dB with the reference signa.