Ee-sim user guide – Maxim Integrated EE-Sim User Manual
Page 21
page
21
EE-Sim User Guide
Run Analysis: Select an analysis typeand enter yourConfigurati onsettings. ClickRun Analysisto generate a default waveform.
Waveforms: EE-Sim offers you several diff erent types ofsimulationresults including Bode plot, IC, Input, Switching, Output,
Primary, Secondary, and Signals.
Waveform Viewer: Click theOpen in Waveform Viewer button or click the waveform graph to open the WebScope
waveform viewer in a separate window. You can click the tabs available in the viewer to generate and manipulate the plotted
results. The tabs correspond to the available waveforms for your design andselected type of analysis. For example, clickBode
Plot, Secondary, or Signals.
Toolbar:Toolbar buttons allow you to zoom in and out, pan, and print your waveforms. Position your mouseover each toolbar
icon to view its function.
Configurati on Data: You can edit theconfigurati on data to update the waveform. For example, adjust the startti me, stop
time,or change (delta) in ti me. You can also indicate Min, Max, RMS, Pk2Pk, Slope, or Avg electrical values and turn on (check)
or off (uncheck) colorized markers in the plotted area.
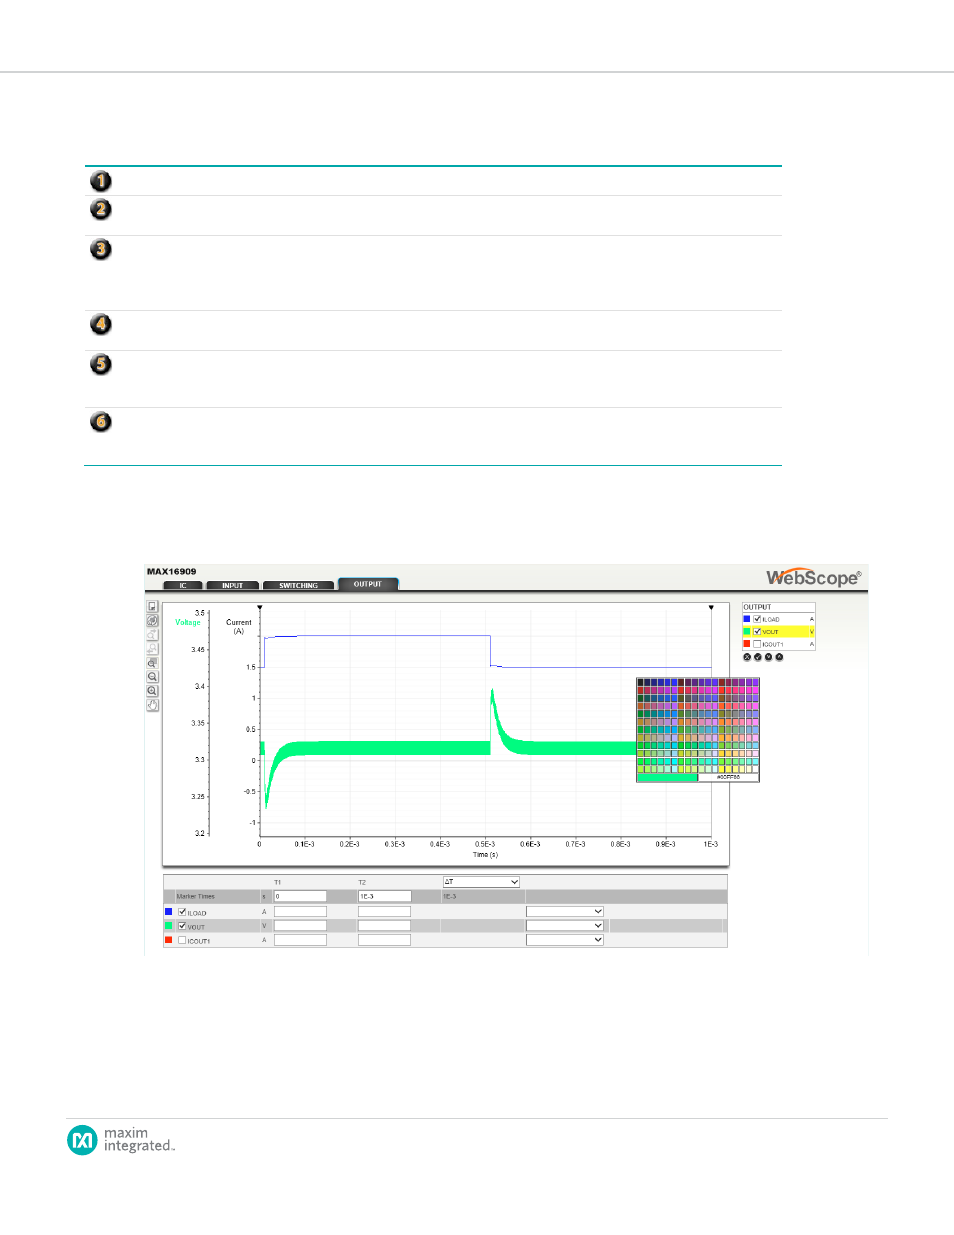
Chart Legend: Show, hide, and adjust the sequence of the plotted current (A) and voltage (V) values. Click a color square to
select a new color from the pop-up color selection swatch. You can alsoturn on (check) oroff(uncheck) acolor-coded series of
values in the waveform.
The following image shows another example of the waveform viewer. In this example, the IC
OUT
1 values in
the Output view are turned off. The color selection pop-up appears because we clicked the V
OUT
green
square icon to change it to another color.