Checkline ETMPX User Manual
Page 7
– 7 –
4.0 TAKING A MEASUREMENT
NOTE: Before taking a measurement, be sure that the correct unit of measurement (
g or cN) has been selected and a zero adjustment has been performed.
4.1 Inserting the process material
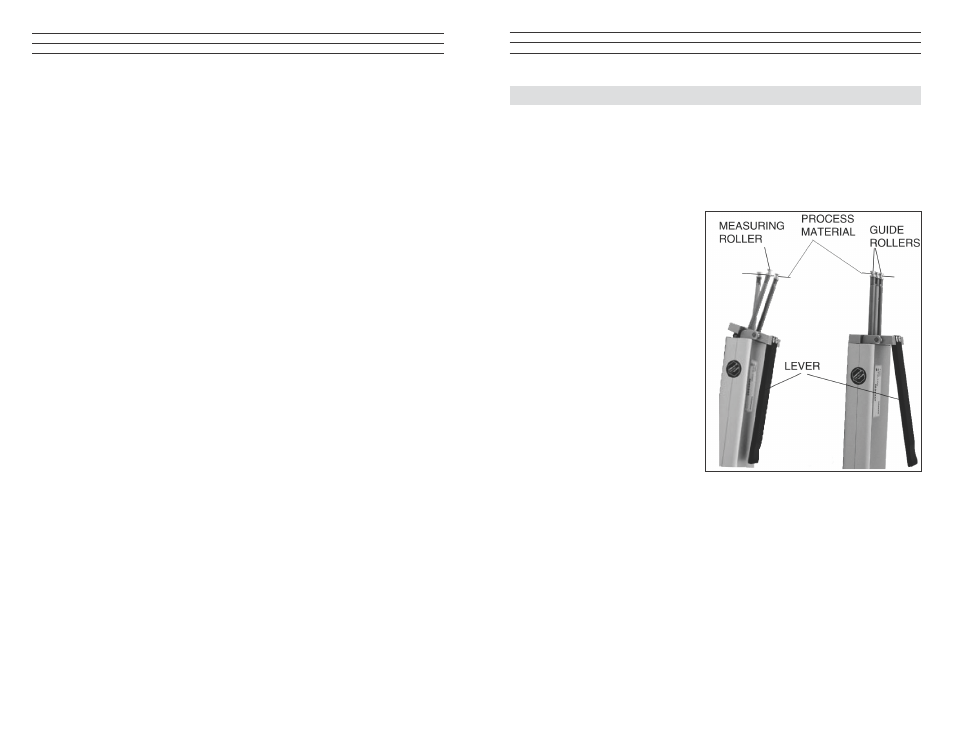
1. Press the LEVER to tilt the outer GUIDE ROLLERS sidewards.
2. Thread the PROCESS
MATERIAL through the
MEASURING and
GUIDE ROLLERS
(filament guide).
3. Slowly release pressure on
the LEVER until the GUIDE
ROLLERS returnto their
original position.
NOTE: It is important to
assure that the PROCESS
MATERIAL runs smoothly
between the MEASURING
and GUIDE ROLLERS.
4.2 Measuring the process
material
The DISPLAY now shows the
measured tension values. Error
messages which might be displayed
are described in Sec.7.7.
4.3 Removing the process material
1. Press the LEVER and remove the PROCESS MATERIAL.
2. Slowly release pressure on the LEVER until the GUIDE ROLLERS
return to their original position.
– 30 –
3.2 Starting and Stopping the Tension Value Display
NOTE: Before beginning, click the CLEAR GRAPH button to clear all readings shown
in the TENSION display, if any.
Start:
1. Click the red START STOP button to activate the display of tension values.The
button color changes to red (function enabled).
Tension value display:
TENSION display
Current graph
TENSION display
Current digital value
STATISTICS display
Continuously updated statistics
STATISTICS DIAGRAM display
Continuously updated statistics of readings shown
in the graph
Stop:
1. Click the now red START STOP button.
The display of the tension values stops. The button color changes back to green
(function disabled).
3.3 Graph adjustments
SCALE
The maximal tension value of the diagram can be adjusted
(Y-axis, starts at „zero).
AUTO
Automatic scaling of the Y-axis depending on the
measured tension values.
RESET
Change of scaling from mode AUTO to SCALE
READINGS ON SCREEN To set the number of readings to be shown in the diagram
(Timescale) (X-axis). The scroll bar turns to red, if more
readings are selected for the diagram than measured.
TIMESHIFTBUFFER
Indicates in % the fill level of the memory. The maximal
numbers of readings will be set in the SETUP.
TIMESHIFT
To select the timeframe of a series of measurements, that
should be displayed in the diagram. If the setup Value of
READINGS ON SCREEN bigger or equal to the
recorded readings, the scroll bar can not be moved.