Humboldt H-4114SD.3F Electrical Density Gauge User Manual
Page 26
23. Graph Refinement and Fit Adjustment
Each point (soil test) on either Graph (Curve) can be evaluated. To do
this use the Back and Forward Arrows at the Top right of the Screen.
Using the Arrows, cycles you through the different Points on the Graph,
and the corresponding number of the current point is shown between
the buttons. The current selected point will be highlighted as a green
box on the Graph. See Screen below:
In addition, each individual point of the Graph can be Enabled or not.
The Gauge defaults to all points of a Soil Model being Enabled, how-
ever, you can turn off individual points. This is typically done to eliminate
outlying points from the Graph to achieve a higher FIT for more accuracy.
You have probably noticed the word FIT with a corresponding number
on the screen for each of the tests you have run. FIT refers to the
overall accuracy of the Curve you have developed. A fit of 1.000 is
perfect and it is recommended that you try to work with a Soil Model
Curve that has a FIT of at least .600. While you can operate with any
FIT; for accurate and reliable readings it is recommended the FIT be
above a .600 reading.
The following Screens show what happens to the overall fit of your Soil
Model Curve when you eliminate an outlying point from the Graph.
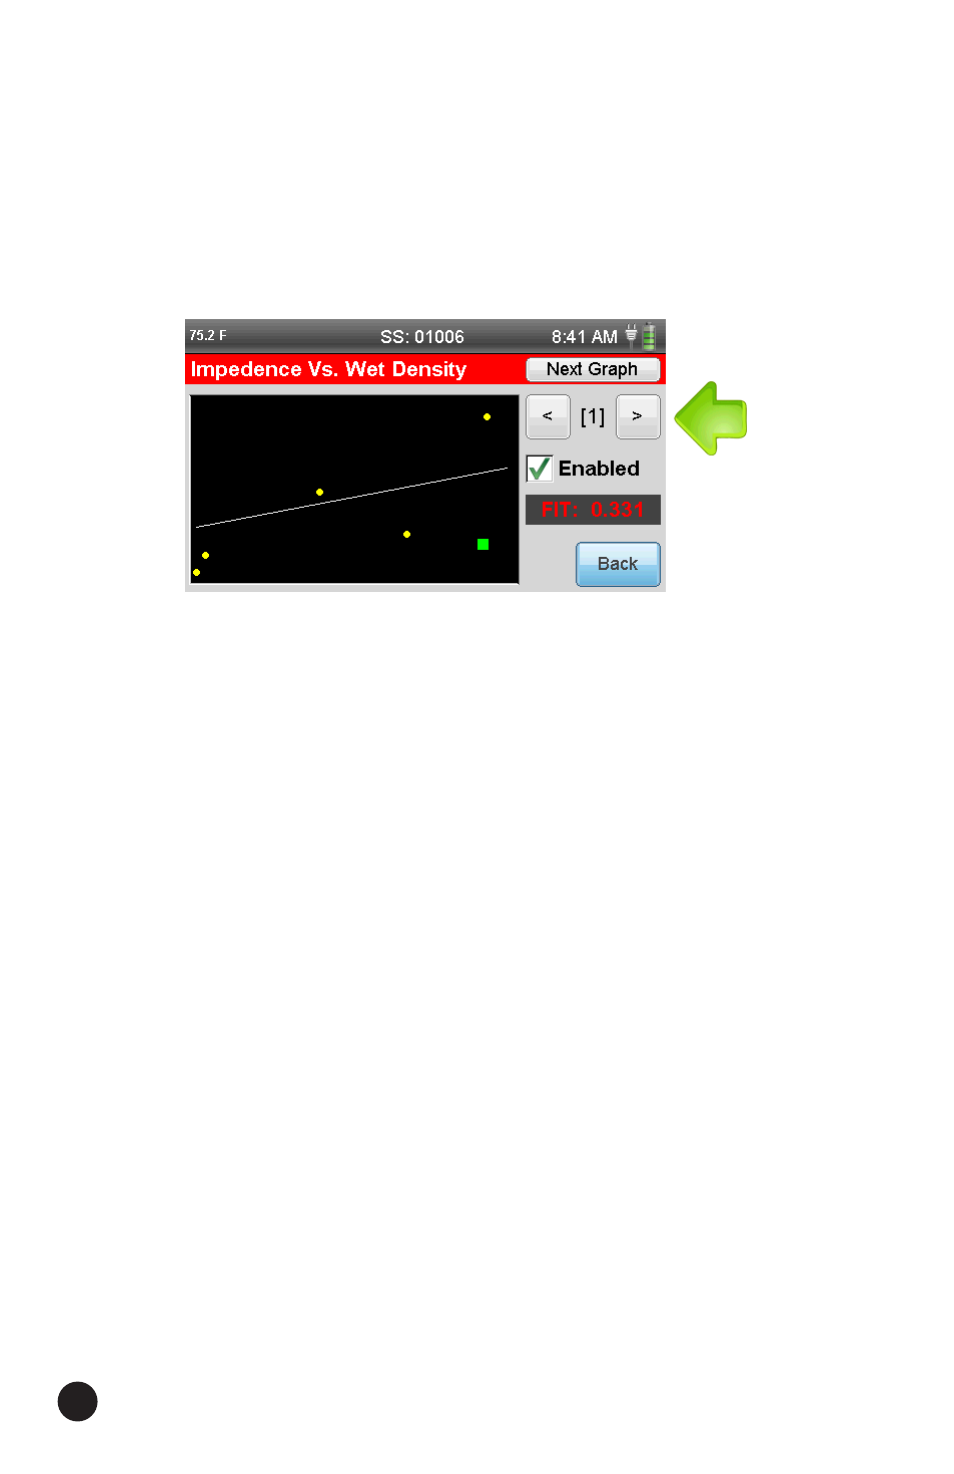
Below is the original Graph with a FIT of 0.331. Point number 1 is
selected, which is indicated by the green square on the graph. This
point is not close to the curve indicated by the white line. Clicking on
the green check mark in the box next to Enabled, turns this point off.
23