Humboldt H-4114SD.3F Electrical Density Gauge User Manual
Page 25
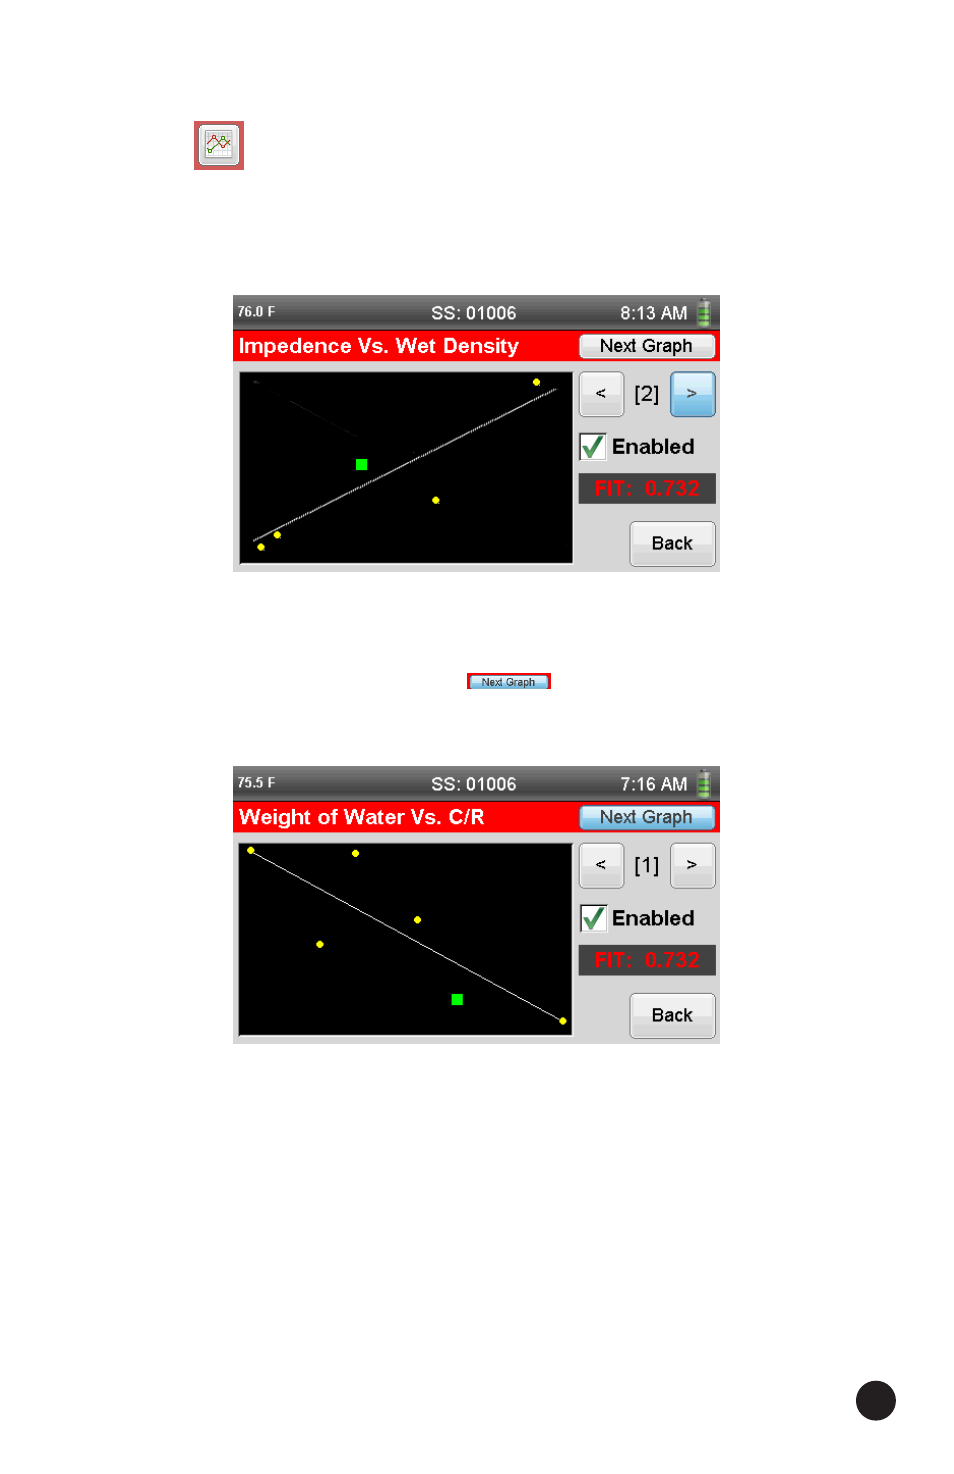
22. Once your Soil Model is completed, you can view the Graphs (Curves),
which make up the Soil Model. To view the Graphs, press the Graphs
button
at the bottom left of the screen next to the Trash button.
There are actually two Graphs, which make up your Soil Model. The
first is the Impedance vs. Wet Density Graph. This Graph should appear
similar to this:
The second Graph is Weight of Water vs. C/R, which you can view by
pressing the Next Graph button
on the top right of the screen.
It will appear similar to this:
22
See also other documents in the category Humboldt Equipment:
- H-4040 Series Water Level Indicators (4 pages)
- 4000 USB Light Weight Deflectometer (96 pages)
- H-4120H Corps of Engineers Cone Penetrometer (8 pages)
- H-4137 Proctor Penetrometer Set (4 pages)
- H-4140 GeoGauge (42 pages)
- H-4166 Voluvessel (8 pages)
- H-4195 Soil Penetrometer, Pocket Style (4 pages)
- H-4200 Soil Penetrometer (4 pages)
- H-4202A Dynamic Cone Penetrometer Set (8 pages)
- H-4204 Proving Ring Penetrometer (8 pages)
- H-4210A Portable, Static Cone Penetrometer (8 pages)
- H-4212MH — Pocket Shear Vane, Metal (2 pages)
- H-4227 Vane Inspection Kit (4 pages)
- H-4385 Resistivity Meter (12 pages)
- H-4386 Soil Box (8 pages)
- HM-4502 Double-Ring Infiltrometer (4 pages)
- HS-4210 Digital Static Cone Penetrometer (8 pages)
- H-1322B Marshall and TSR Compression Machine (12 pages)
- H-9340 Ball & Ring Demonstration (4 pages)
- H-9650 Cork Borer (4 pages)
- H-2790 Hi-Low Detector (4 pages)
- H-3220A Benkelman Beam (8 pages)
- H-1684 Flakiness Gauge for Classification of Aggregate (4 pages)
- H-1686 Void Content Apparatus for Coarse Aggregate (4 pages)
- H-2713A Specific Gravity Bench Set (8 pages)
- H-3383F Humboldt Specific Gravity Flask (Phunque Flask) (8 pages)
- H-3860A Los Angeles Abrasion Machine (8 pages)
- H-4288 Universal Sample Splitter (4 pages)
- H-4325 Sieve Shaker (4 pages)
- HP-1160 Falling Sand Abrasion Tester (4 pages)
- H-3050 Humboldt Vicat Tester (8 pages)
- H-3150 Gilmore Apparatus (4 pages)
- H-3248 Length Comparators (12 pages)
- H-3492A Organic Impurties Test Set (2 pages)
- H-3600 Cement Bleeding Apparatus (4 pages)
- H-3620 Flow Table with Mold (8 pages)
- H-3630A Water Retention Apparatus (4 pages)
- H-1021 Force Determination Adapter (12 pages)
- H-1050 Ductility Machine (8 pages)
- H-1068 Series Ductility Testing Machines (8 pages)
- H-1200 Universal and Portable Penetrometers (8 pages)
- H-1240 Electric Penetrometer with Digital Automatic Timer (8 pages)
- H-1240D Digital Penetrometer with Digital Automatic Timer (8 pages)
- H-1336D Marshall Mechanical Compactors (8 pages)