Figure 4 - frequency response graphs – Rockwell Automation 1769-IT6 Compact I/O 1769-IT6 Thermocouple/mV Input Module User Manual
Page 49
Rockwell Automation Publication 1769-UM004B-EN-P - March 2010
49
Module Data, Status, and Channel Configuration Chapter 4
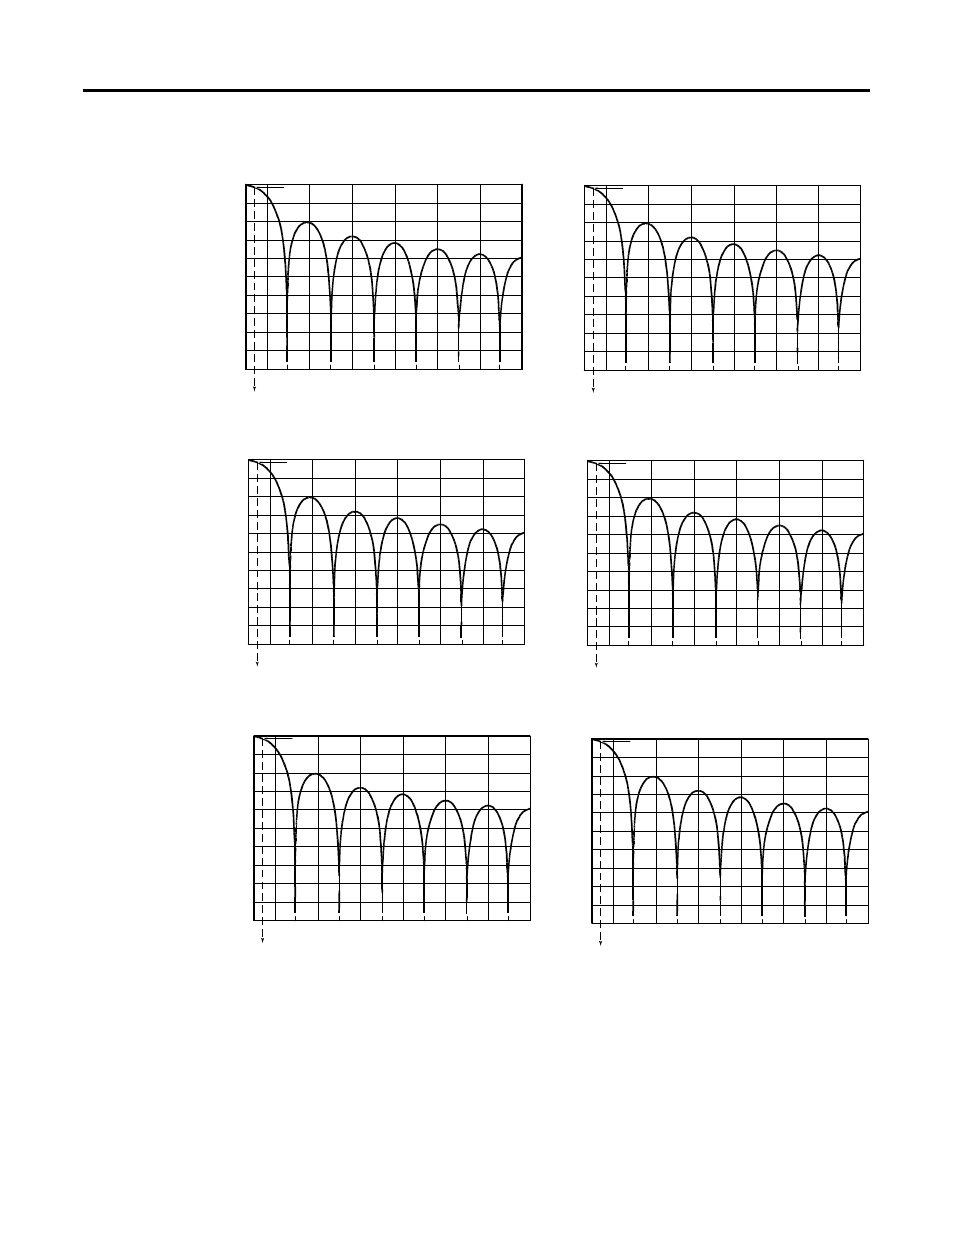
Figure 4 - Frequency Response Graphs
The cut-off frequency for each channel is defined by its filter frequency selection.
Choose a filter frequency so that your fastest changing signal is below that of the
filter’s cut-off frequency. The cut-off frequency should not be confused with the
update time. The cut-off frequency relates to how the digital filter attenuates
frequency components of the input signal. The update time defines the rate at
which an input channel is scanned and its channel data word is updated.
–3 dB
360
0
300
180
120
60
1 5 .72 Hz
240
–3 dB
60
0
50
30
20
10
2.62 Hz
40
–3 dB
300
0
250
150
100
50
13. 1 Hz
200
0
–40
–60
–80
-100
-120
-140
-160
-180
- 200
–20
0
–40
–60
–80
-100
-120
-140
-160
-180
- 200
–20
0
–40
–60
–80
-100
-120
-140
-160
-180
- 200
–20
0
–40
–60
–80
-100
-120
-140
-160
-180
- 200
–20
0
–40
–60
–80
-100
-120
-140
-160
-180
- 200
–20
0
–40
–60
–80
-100
-120
-140
-160
-180
- 200
–20
–3 dB
1300
0
1150
750
500
250
65 .5 Hz
900
–3 dB
3000
0
2500
1500
1000
500
1 31 Hz
2000
–3 dB
6K
0
5K
3K
2K
1K
262 Hz
4K
10 Hz Input Filter Frequency
50 Hz Input Filter Frequency
250 Hz Input Filter Frequency
500 Hz Input Filter Frequency
Frequency (Hz)
Frequency (Hz)
Frequency (Hz)
Frequency (Hz)
Gain (dB)
Gain (dB)
G
ain
(d
B)
Gain (dB)
1000 Hz Input Filter Frequency
Frequency (Hz)
Gain (dB)
60 Hz Input Filter Frequency
Frequency (Hz)
G
ain (dB)