KD Scientific Adagio Control Software for Legato Series Manual User Manual
Page 25
Adagio User Manual
© 2010 KD Scientific
5619-001 Rev B
25
The first step block is always located at the left most side of the graph
plot. As no time gaps are allowed between two steps, the following blocks will
be drawn next to the previous one.
Step blocks can be easily selected by clicking on them with the left
mouse button (when in selection mode).
4.2.4.2. Graph’s axis
The flow evolution graph includes a pair of orthogonal axis representing
the time (x-axis) and the flow rate (y-axis).
X-axis has the following characteristics:
• Values are measured and shown in time format (hh:mm:ss).
• The minimum value is always 00:00:01.
• The maximum value is determined by the end time of the last step
defined within the method. Whereas no steps were defined, a default
maximum value of 30 minutes is applied.
• Time precision is the same as the command latency of the selected
pump model.
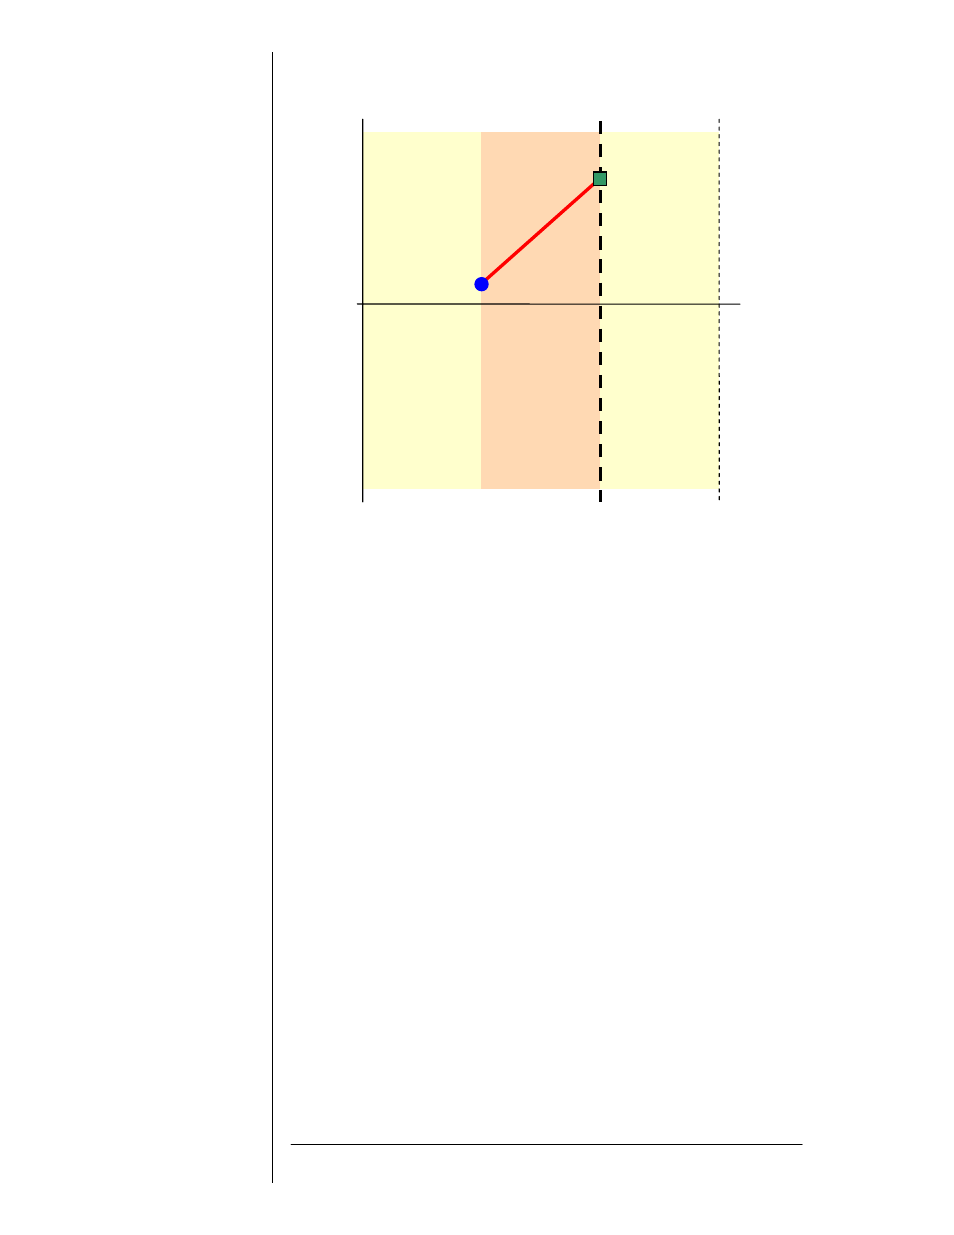
Duration
marker
Step block
Start flow
marker
End flow
marker
Expected flow
evolution line
Step block
Step block
X-axis
(time)
Y-axis
(flow)