Toshiba Magnia 550d User Manual
Page 42

Sensor and disk status
Item Explanation
-Normal-
Displays that all the sensors (disks) are in a normal state or have some
information.
-Abnormal-
Displays that the sensors (disks) have some warnings or errors.
-Unknown-
Displays that the sensors (disks) are unknown.
Summary Screen (Details)
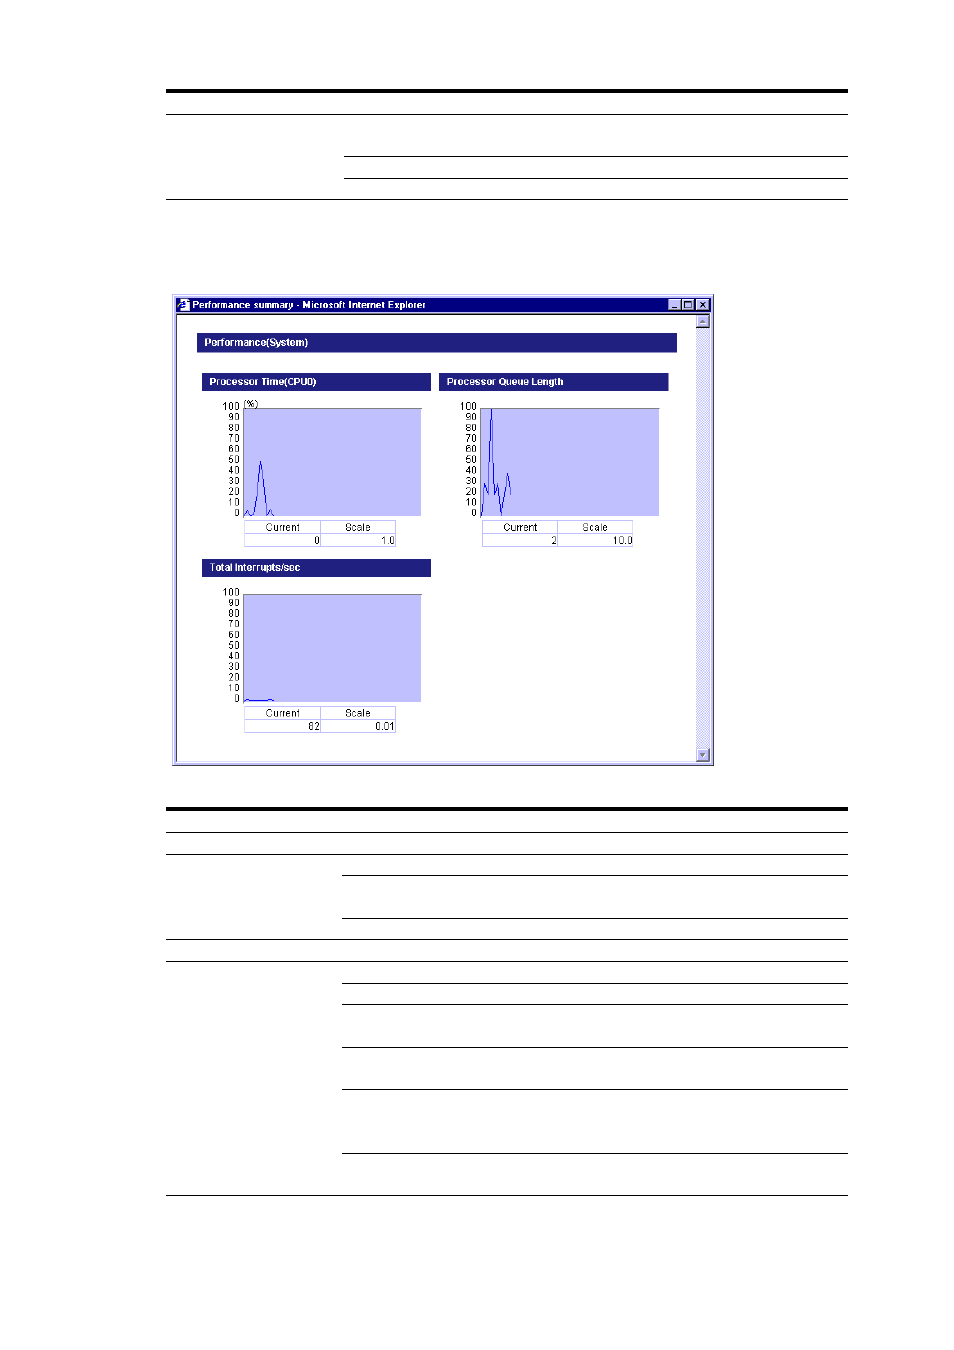
When you click [Detail] buttons in the Summary screen, the screen shown below is displayed
in a separate window.
Summary screen (Details)
Item Explanation
System
Displays the system information
-Processor Time-
Displays the use ratio of the CPU.
-Processor Queue
Length-
Displays the Processor’s waiting queue.
-Total Interrupts/sec--
Displays the interrupt frequency of the hardware.
Memory
Displays the memory information.
-Available Bytes-
Displays the number of usable bytes of the physical memory.
-Page Faults/sec-
Displays the number/seconds of the page faults.
-Pool Nonpaged Peak-
Displays the maximum number of bytes of a Nonpaged pool that the server
used at a certain moment.
-% Committed Bytes In
Use-
Displays the committed size of virtual memory
-Pool Nonpaged Bytes-
Displays the number of Pool Nonpaged Bytes; the system memory area for
the objects that exist in the physical memory without writing them to the
disk.
-Pool Paged Bytes-
Displays the number of Pool Paged Bytes; the system memory area for the
objects which are enabled to be written when it is not in use.
30
