HP Storage Mirroring Software User Manual
Page 84
82 of 118
●
Contoured—If selected, the contour lines for different contour levels are
drawn.
●
Zoned—If selected, the bar or surface is colored into different zones.
●
Projection—The degree of perspective of the 3D plot cube.
●
Contour Levels—Number of levels of contour. When contoured or zoned,
the 3D bar or surface is divided into the number of contour levels specified.
●
Zone Colors—Colors to use for the different zones. The gradient color bar is
divided into the number of zones as specified in the contour levels. Right-
clicking allows adding, removing and editing the colors of the zone color bar.
3. The display is updated to show the new gradient. You can add zone points to the
gradient by right-clicking the color chart and selecting Add. A new point is added
to the color chart with the color selected.
4. Click OK.
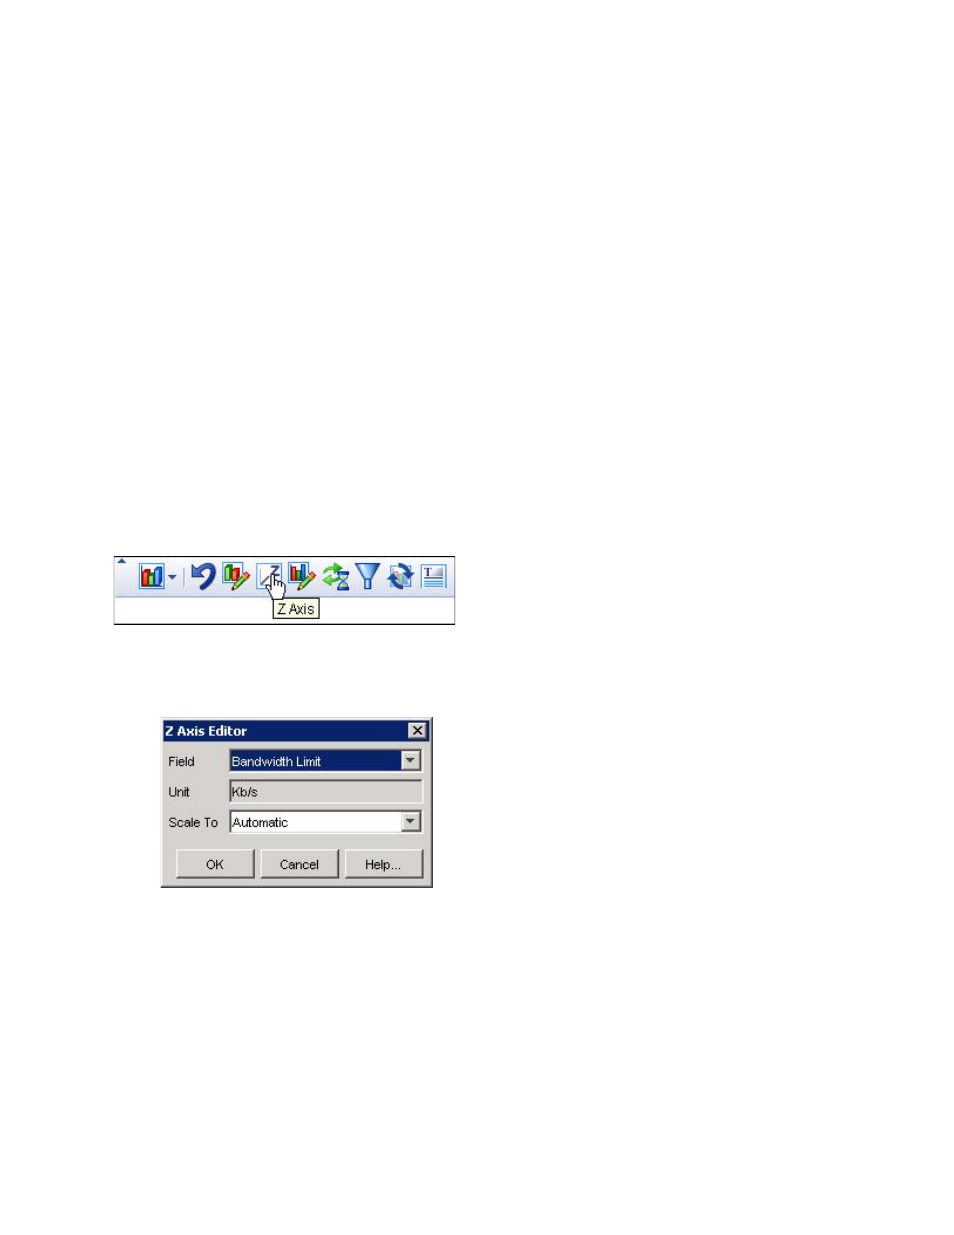
Z axis
The Z axis parameter allows you to select the field to be plotted on the Z axis and set the
scale used for plotting.
To modify the Z axis:
1. Click Z axis icon. The Z Axis Editor dialog box appears.
2. Specify the following fields.
●
Field—Field to plot.
●
Unit—Unit for the selected field (not editable)
●
Scale To—The multiplier the field is scaled to. Selecting None does not
perform any scaling. Automatic scales to the highest possible multiplier.
3. Click OK.
Chart style
The Chart Style appearance parameter is common to all chart-based reports. It provides